-
A–D
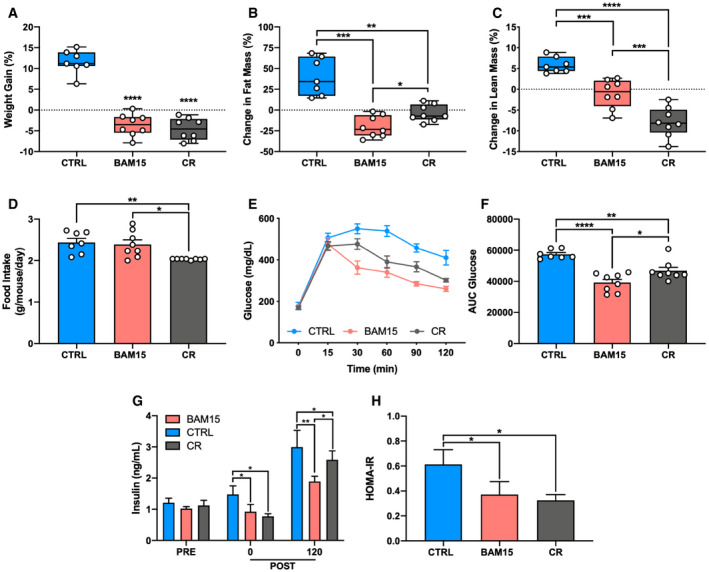
(A) Change in body weight (CTRL versus BAM15: P < 0.0001, CTRL versus CR: P < 0.0001), (B) fat mass (CTRL versus BAM15: P = 0.0005, CTRL versus CR: P = 0.0041, BAM15 versus CR: P = 0.043), and (C) lean mass (CTRL versus BAM15: P = 0.0014, CTRL versus CR: P < 0.0001, BAM15 versus CR: P = 0.0047) from baseline to 2 weeks in CTRL‐, BAM15‐, and CR‐treated animals and (D) daily food intake (CTRL versus CR: P = 0.0092, BAM15 versus CR: P = 0.0175) in CTRL‐, BAM15‐, and CR‐treated animals (CTRL N = 7, BAM15 and CR N = 8).
-
E, F
(E) Blood glucose concentrations at 0, 15, 30, 60, 90, and 120 min following intraperitoneal injection of glucose (2 g glucose/kg of body weight; N = 8 per group) and (F) total area under the curve glucose (CTRL versus BAM15: P < 0.0001, CTRL versus CR: P = 0.003, BAM15 versus CR: P = 0.0261) after 2 weeks of treatment in CTRL‐, BAM15‐, and CR‐treated animals (CTRL N = 7, BAM15 and CR N = 8).
-
G, H
(G) Plasma insulin concentrations at baseline (PRE), and 0 (CTRL versus BAM15: P = 0.0154, CTRL versus CR: P = 0.0425) and 120 min (CTRL versus BAM15: P = 0.0005, CTRL versus CR: P = 0.0211, BAM15 versus CR: P = 0.0264) after injection of glucose after 2 weeks of treatment in CTRL‐, BAM15‐, and CR‐treated animals (CTRL N = 7, BAM15 and CR N = 8) and (H) Homeostatic Model Assessment of Insulin Resistance (HOMA‐IR) (CTRL versus BAM15: P = 0.0259, CTRL versus CR: P = 0.040) after 2 weeks of treatment in CTRL‐, BAM15‐, and CR‐treated animals (CTRL N = 7, BAM15 and CR N = 8).
Data information: Data are shown as the mean ± SEM with exception to panels A, B, and C which are displayed as a box (mean ± 5‐95% CI) and whiskers (minimum to maximum). *
< 0.001. Panel G was assessed by two‐way repeated‐measures ANOVA with Tukey's multiple comparisons. Panels A, B, C, D, F, and H were assessed by one‐way ANOVA with Tukey's multiple comparisons.

