
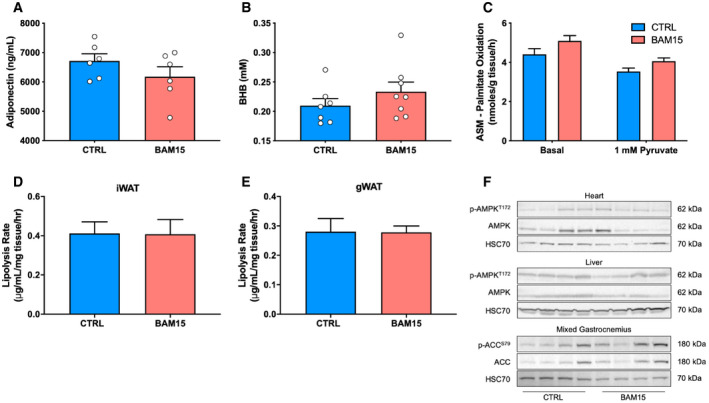
Figure EV5. Related to Fig 6. BAM15 restricts adipose tissue expansion and lipid deposition to liver and kidney in C57BL/6J mice.
-
A, B(A) Circulating adiponectin (N = 6 per group) and (B) beta‐hydroxybutyrate (BHB) (CTRL N = 7, BAM15 N = 8) concentrations in CTRL‐ and BAM15‐treated animals.
-
CFatty acid oxidation attributable to acid‐soluble metabolites (ASM) in mixed gastrocnemius muscle ± 1 mM pyruvate (N = 7 per group).
-
D, E(D) Ex vivo rates of glycerol release from iWAT and (E) gWAT in CTRAL‐ and BAM15‐treated animals (N = 8 per group).
-
FRepresentative immunoblots of p‐AMPKT172 and AMPK from heart and liver homogenates and p‐ACCS79 and ACC from mixed gastrocnemius muscle.