-
A–D
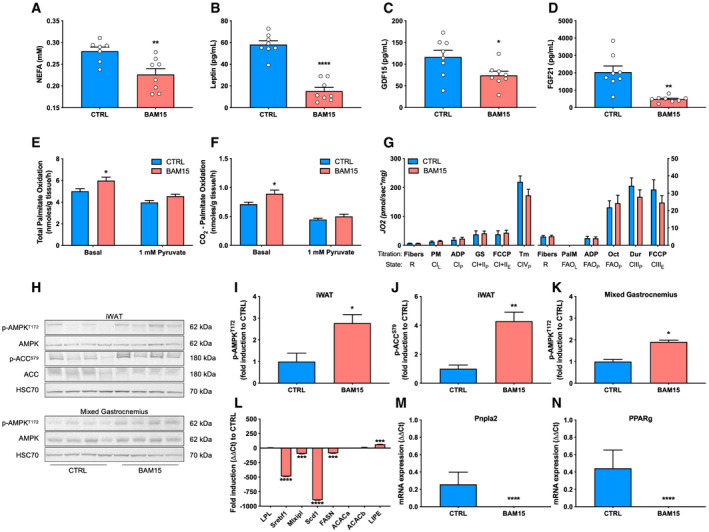
(A) Plasma concentrations of non‐esterified fatty acids (NEFAs) (CTRL N = 7, BAM15 N = 8, P = 0.0073), (B) leptin (N = 8 per group, P < 0.0001), (C) GDF15 (N = 7 per group, P = 0.035), and (D) FGF21 (N = 7 per group, P = 0.0026) after 3 weeks of CTRL or BAM15 treatment.
-
E, F
(E) Total (basal: P = 0.015) and (F) complete (basal: P = 0.0137) oxidation of 200 μM [1‐14C]palmitate to CO2 from mixed gastrocnemius muscle homogenates (N = 7 per group).
-
G
Routine (R) oxygen flux, leak (L), OXPHOS (P), and ETC. (E) capacity in permeabilized mixed gastrocnemius fibers (N = 6 per group). PM: pyruvate and malate, ADP: adenosine diphosphate, GS: glutamate and succinate, Tm: tetramethyl‐p‐phenylenediamine, PalM: palmitoylcarnitine and malate, Oct: octanoylcarnitine, and Dur: duroquinol.
-
H–K
(H) Representative immunoblots of phosphorylated and total AMPK and ACC from iWAT, and mixed gastrocnemius muscle and (I‐K) densitometric quantification (N = 4 per group; iWAT p‐AMPKT172: P = 0.0186, iWAT p‐ACCS79: P = 0.0083, mixed gastrocnemius p‐AMPKT172: P = 0.0286).
-
L–N
mRNA expression of transcriptional regulators of lipogenesis and lipolysis in iWAT (N = 7 per group). Srebf1 (P < 0.0001), Mlxipl (P = 0.0018), Scd1 (P < 0.0001), FASN (P = 0.0009), LIPE (P = 0.0015), Pnpla2 (P < 0.0001), PPARg (P < 0.0001).
Data information: Data are shown as the mean ± SEM. *
P < 0.05, **
P < 0.01, ***
P < 0.01, ****
P < 0.001. Panels E, F, and G were assessed by two‐way repeated‐measures ANOVA with Tukey's multiple comparisons. Panels A, B, C, D, I, J, K, L, M, and N were assessed by an unpaired Student's
t‐test.
Source data are available online for this figure.