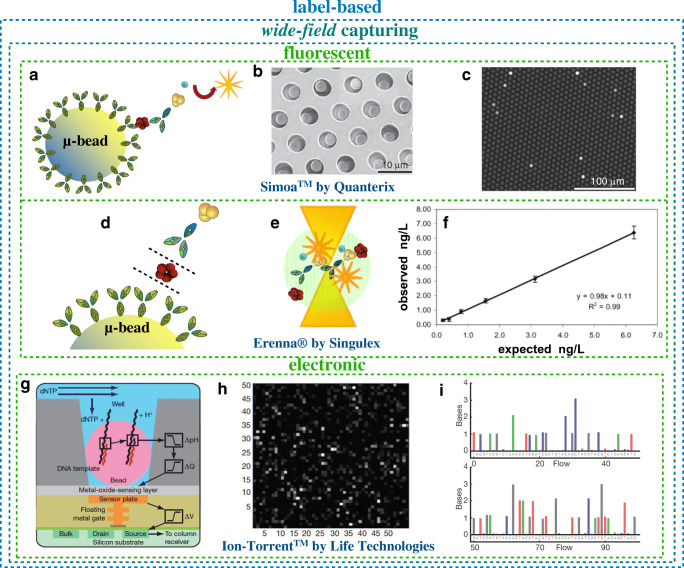
Fig. 3.
Wide-field capturing technologies. a Microbead biofunctionalized with specific capture antibodies according to the three-step ELISA detection strategy. b Scanning electron micrograph of a portion of a femtoliter-volume size-exclusion microwell Simoa™ array after bead loading. c Fluorescence image of the array showing the signals generated from single beads that are hosted in different wells (panels a, b, and c are reprinted with permission from Ref. [18] Copyright 2010 Springer Nature). d A magnified view of the biofunctionalized magnetic microbead. e A reproduction of fluorescently labelled antibodies to be counted while they pass through the confocal microscope focus. f Cardiac troponin I concentration is measured using standard solutions (observed concentration) of known nominal concentration (expected concentration). Concentrations are given in nanograms per liter; given that the molar mass of cardiac troponin is 22.5 kDa, this is equivalent to 40 fM. (Reprinted with permission from Ref. [19] HighWire Press; American Association for Clinical Chemistry, copyright 2007). g Pictorial reproduction of an Ion Torrent pixel, see text for details. h Picture of 2500 wells with bright intensity indicating the number of bases incorporated per well at a given nucleotide flow. i Chart indicating the first 100 nucleotide flows for one well with each bar height corresponding to the number of nucleotides incorporated; the color code accounts for the different nitrogenous basis: adenine (A, green), guanine (G, gray), thymine (T, red) and cytosine (C, blue) (panels g, h, and i are reprinted with permission from Ref. [20] Copyright 2011 Springer Nature)

