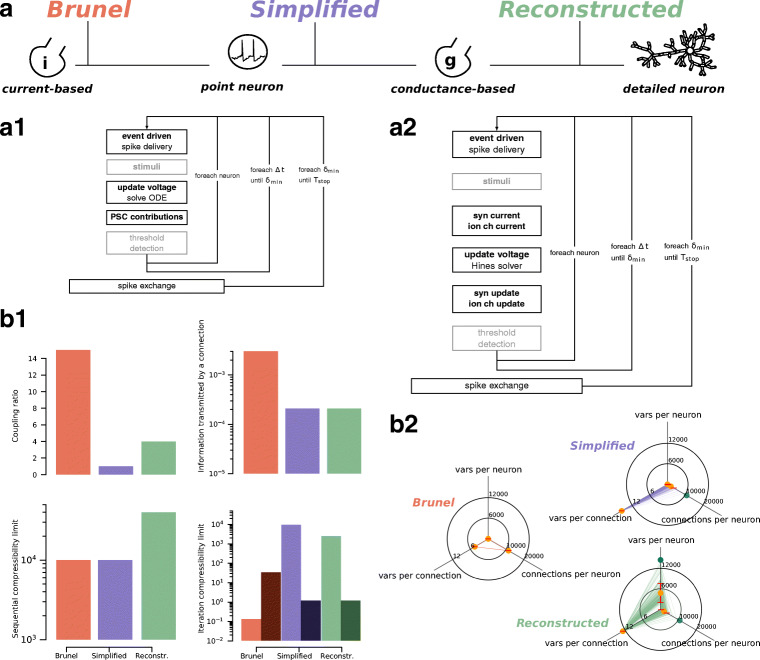
Fig. 2.
In silico models and experiments. Presentation and summary of the in silico models and experiments examined in this paper. a Color-coding for the three in silico models and salient features: in red the I-based point neuron Brunel model, in purple the G-based point neuron Simplified model and in green the G-based detailed neuron Reconstructed model. a1,a2 I-based (resp. G-based) simulation algorithm. The simulation kernels within light grey boxes are included for completeness but are not considered in our analysis because they are not part of the computation loop. The larger boxes denote a synchronization point for distributed simulations. b1 Hardware-agnostic metrics. Coupling ratio denotes the number of simulation timesteps before a global synchronization point. Information transmitted by a connection denotes the average number of variables transmitted via a connection during one minimum delay period. Sequential compressibility limit denotes the number of time iterations required to simulate one second of biological time. Iteration compressibility limit denotes the number of degrees of freedom updated in a interval. Lighter bars represent clock-driven updates, darker bars represent (average) event-driven updates. b2 Breakdown of the unit size metric. This metric captures the memory footprint of in silico models, broken down in three components: number of variables to represent a single neuron excluding synaptic connections, number of variables to represent a connection, and number of connections per neuron. Orange dots represent mean values, red bars represent standard deviation and green dots represent maximal values. The lines represent actual samples from the model

