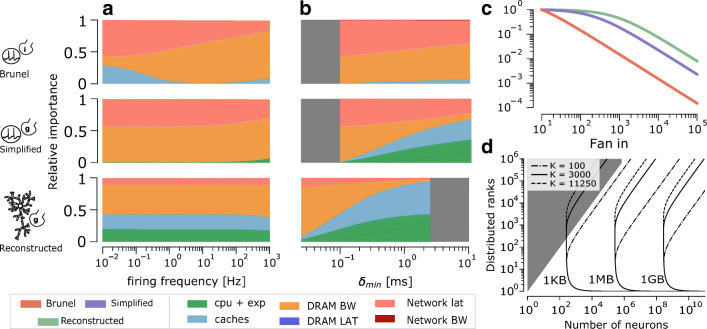
Fig. 9.
a Stacked plot of the mean relative contributions from hardware features as a function of the average firing frequency of neurons in the simulation. The mean was extracted by simulating 1000 randomly generated simulation configurations, defined by number of neurons and number of distributed ranks. b Stacked plot of the mean relative contributions from hardware features as a function of the . The range of acceptable values for changes across different in silico models because they were computed as multiples of the model’s timestep, hence the greyed-out areas. c Number of neurons able to fit in 1 GB of memory, normalized by the memory requirements of a model with 10 incoming synapses, as a function of the average fan in per neuron. d Contour plot of predicted memory requirements of the connections table, as a function of the total number of neurons (x axis) and the number of distributed ranks (y axis). The contour levels corresponding to 1 KB, 1 MB and 1 GB are shown for different values of the fan in

