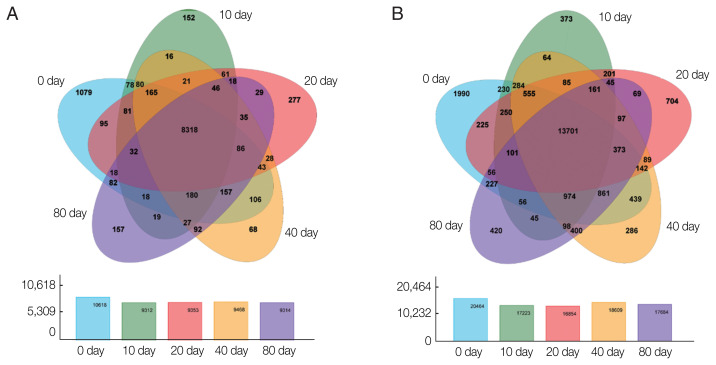
Fig. 2.
Venn diagrams showing differentially expressed genes among the experimental groups. Circles of different colors represent a set of (A) genes and (B) transcripts expressed in a sample, where the values represent the number of common and uniquely expressed genes/transcripts between a 2-or3-group sample. The sum of all numbers inside the circle represents the group. The sum of the number of expressed genes, the cross-region of the circle, represents the number of shared genes of each group of expressed genes/transcripts.

