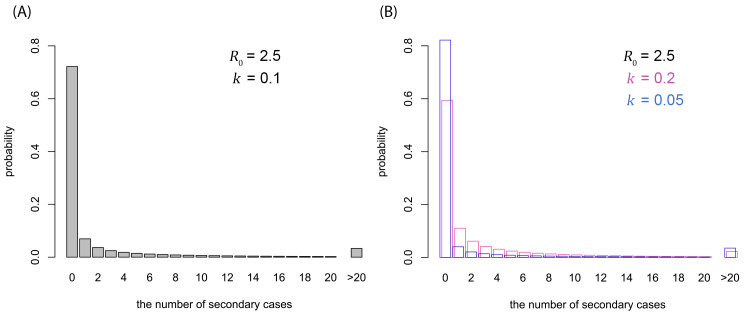
Figure 2. Possible offspring distributions of COVID-19.
( A) Offspring distribution corresponding to R 0 = 2.5 and k = 0.1 (median estimate). ( B) Offspring distribution corresponding to R 0 = 2.5 and k = 0.05 (95% CrI lower bound), 0.2 (upper bound). The probability mass functions of negative-binomial distributions are shown.

