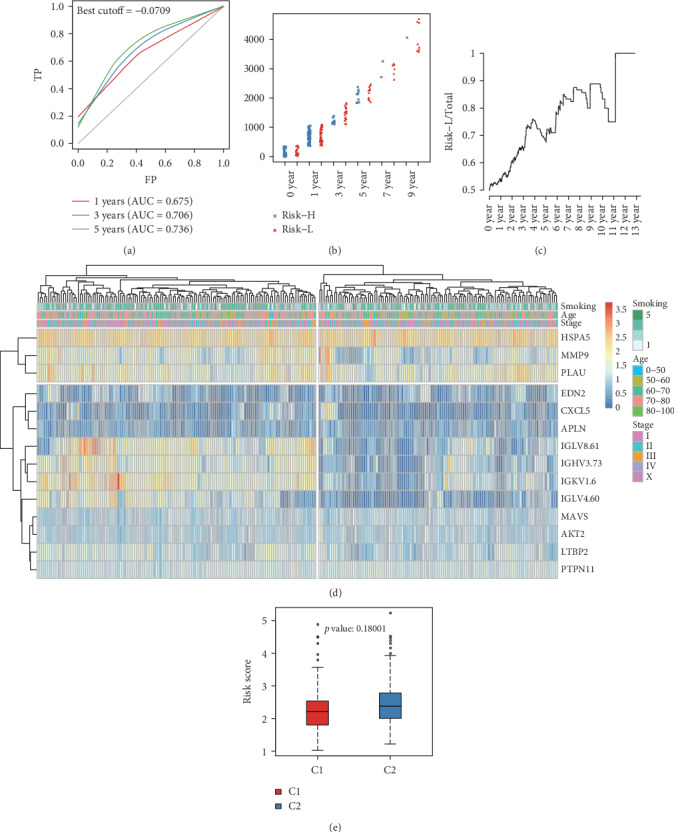
Figure 3.

Verification of the stability of the prognosis prediction model for patients with lung squamous cell carcinoma in the training cohort. (a) Survival predicted ROC curves for the training cohort. (b) Distribution of samples in Risk-H and Risk-L groups of the training cohort divided by different OS. (c) The proportion of low-risk samples in total samples varies with OS. (d) Clustering results of the training cohort. (e) Differences in risk score values between Risk-H and Risk-L groups clustered by gene expression in the training cohort.
