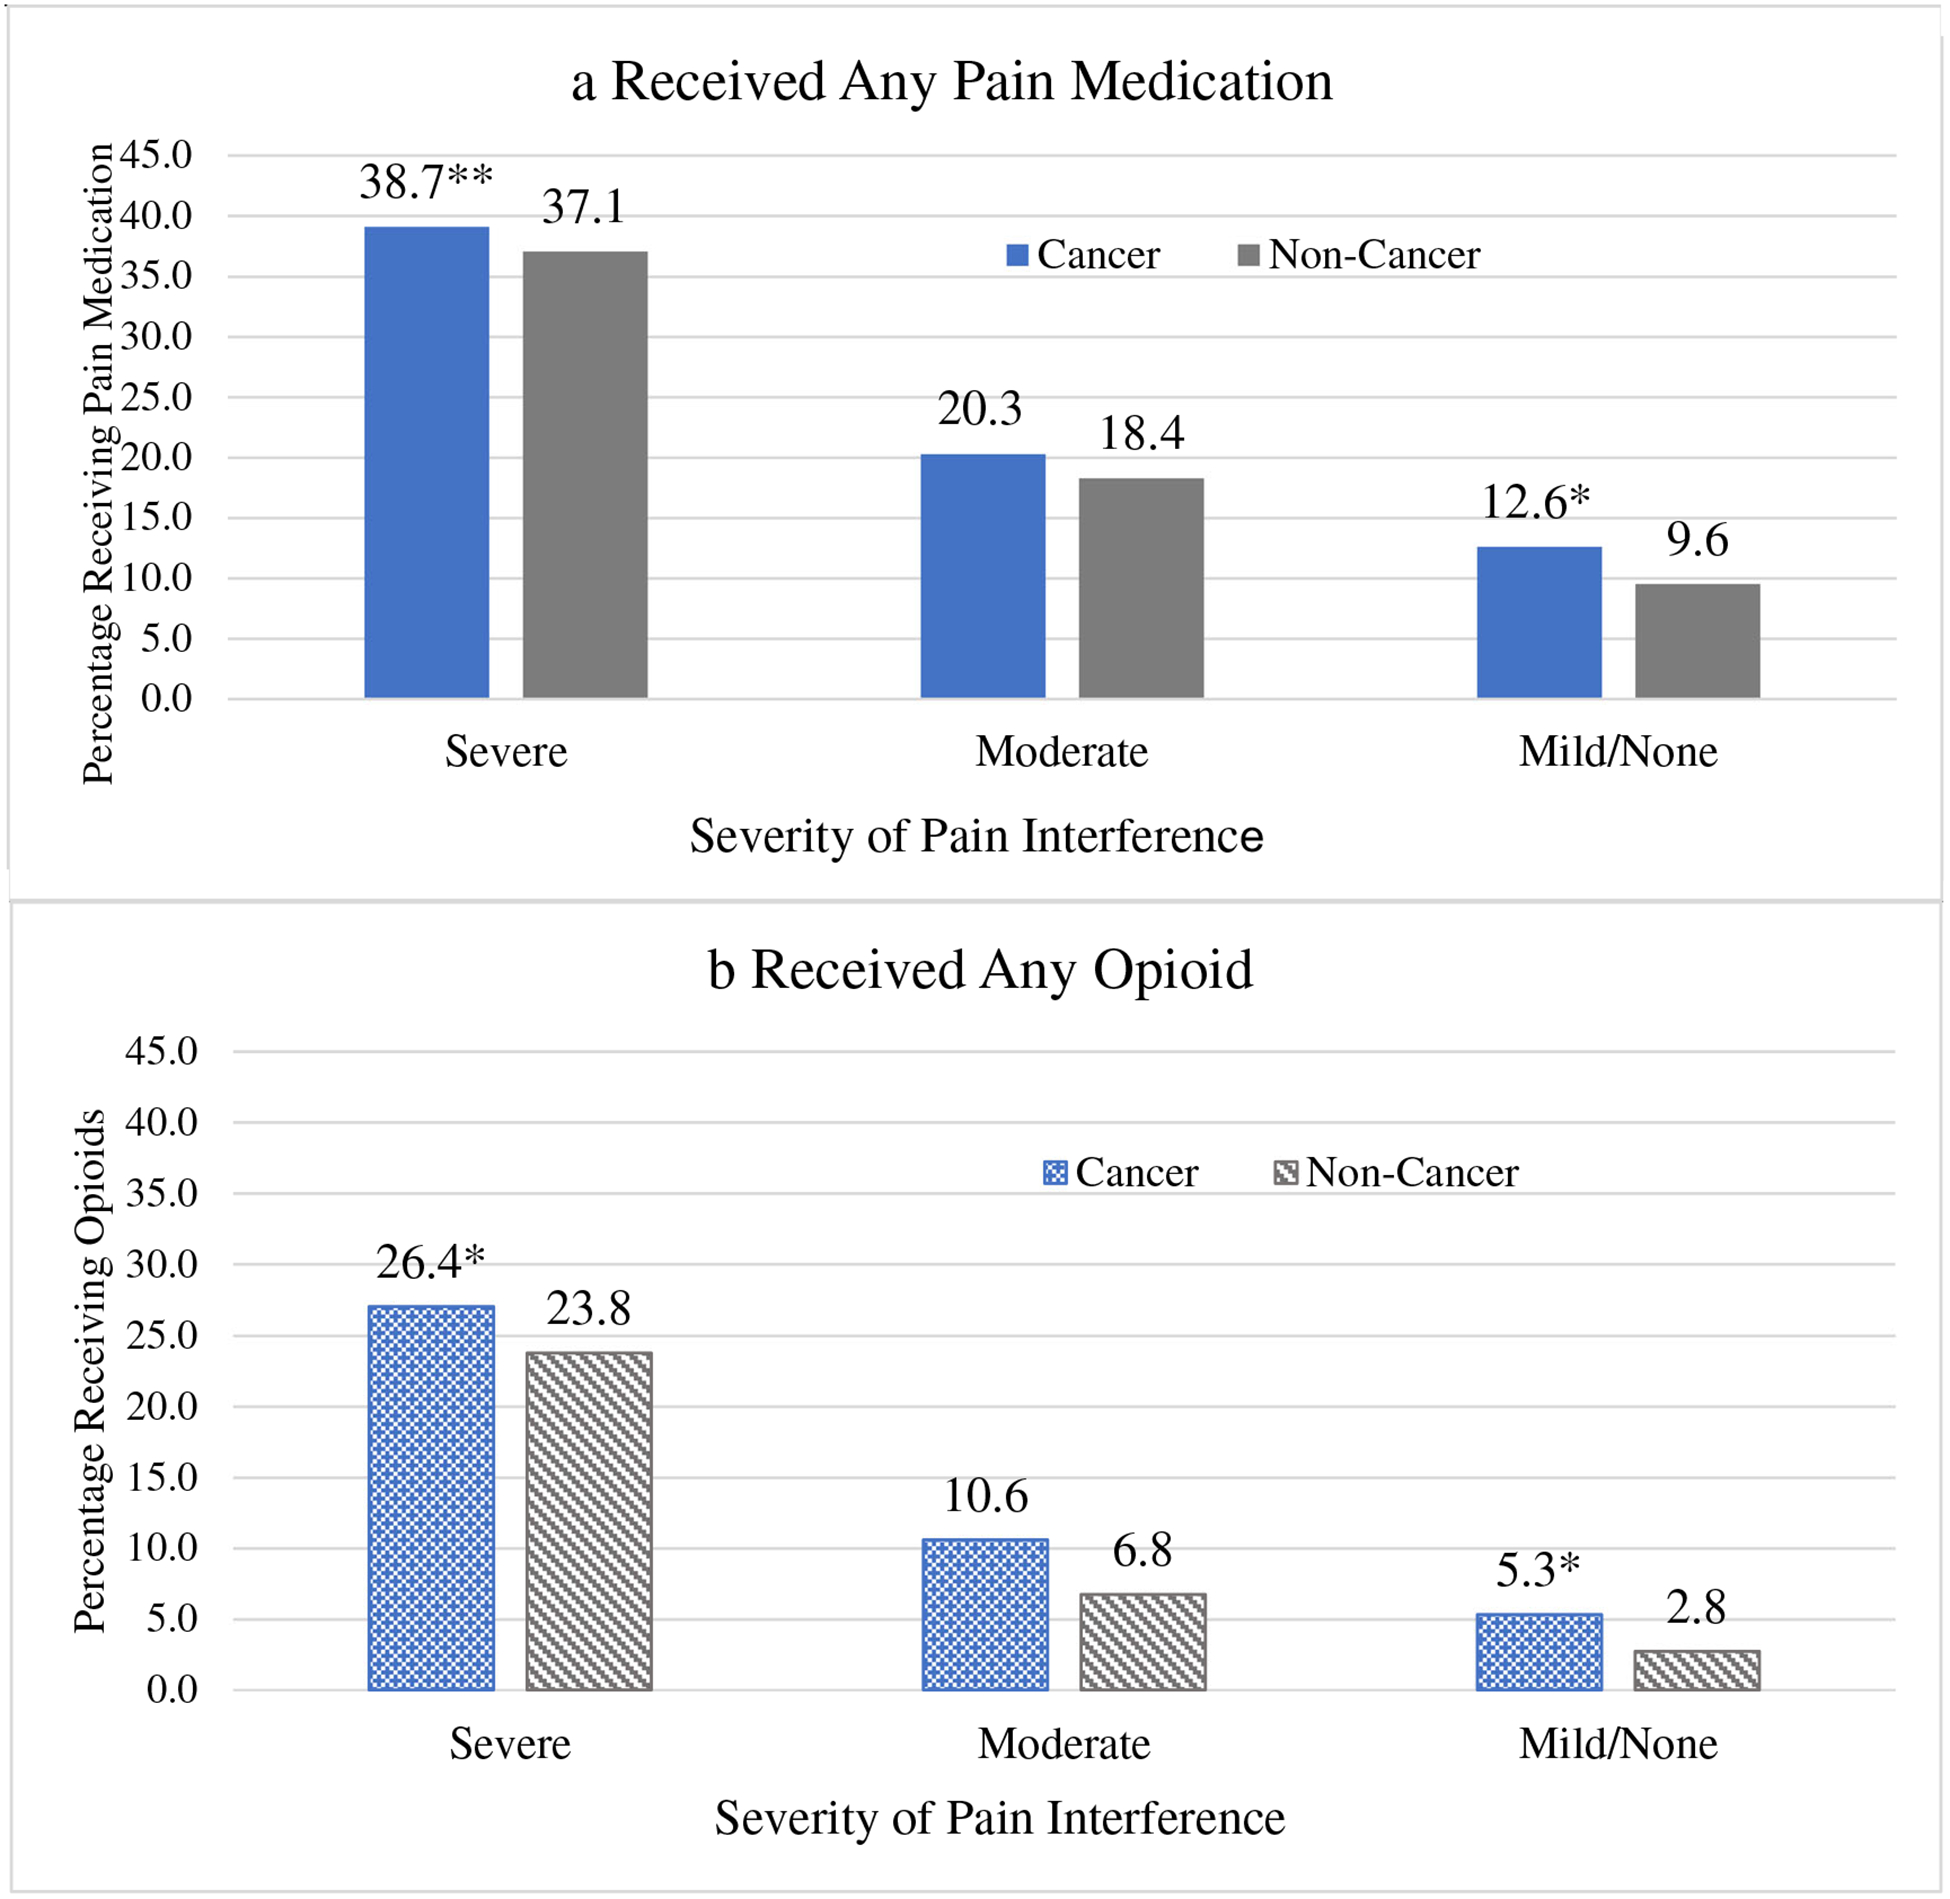
Fig. 1.

Adjusted Levels (predictive margins) for pain medication receipt by severity of pain interference and cancer history. Definition: color graphic with shading
Models adjust for age, sex, race/ethnicity, marital status, education, comorbidities, area poverty rates, region of the country, Part D LIS, and plan type. Levels of any pain medication use (Figure 1a) or any opioid use (Figure 1b) differ by cancer history when stratified by pain severity at * p<.01; **p<.05. Abbreviations: CA, cancer. Source: SEER-MHOS-Part D linked data, 2008–2012.
