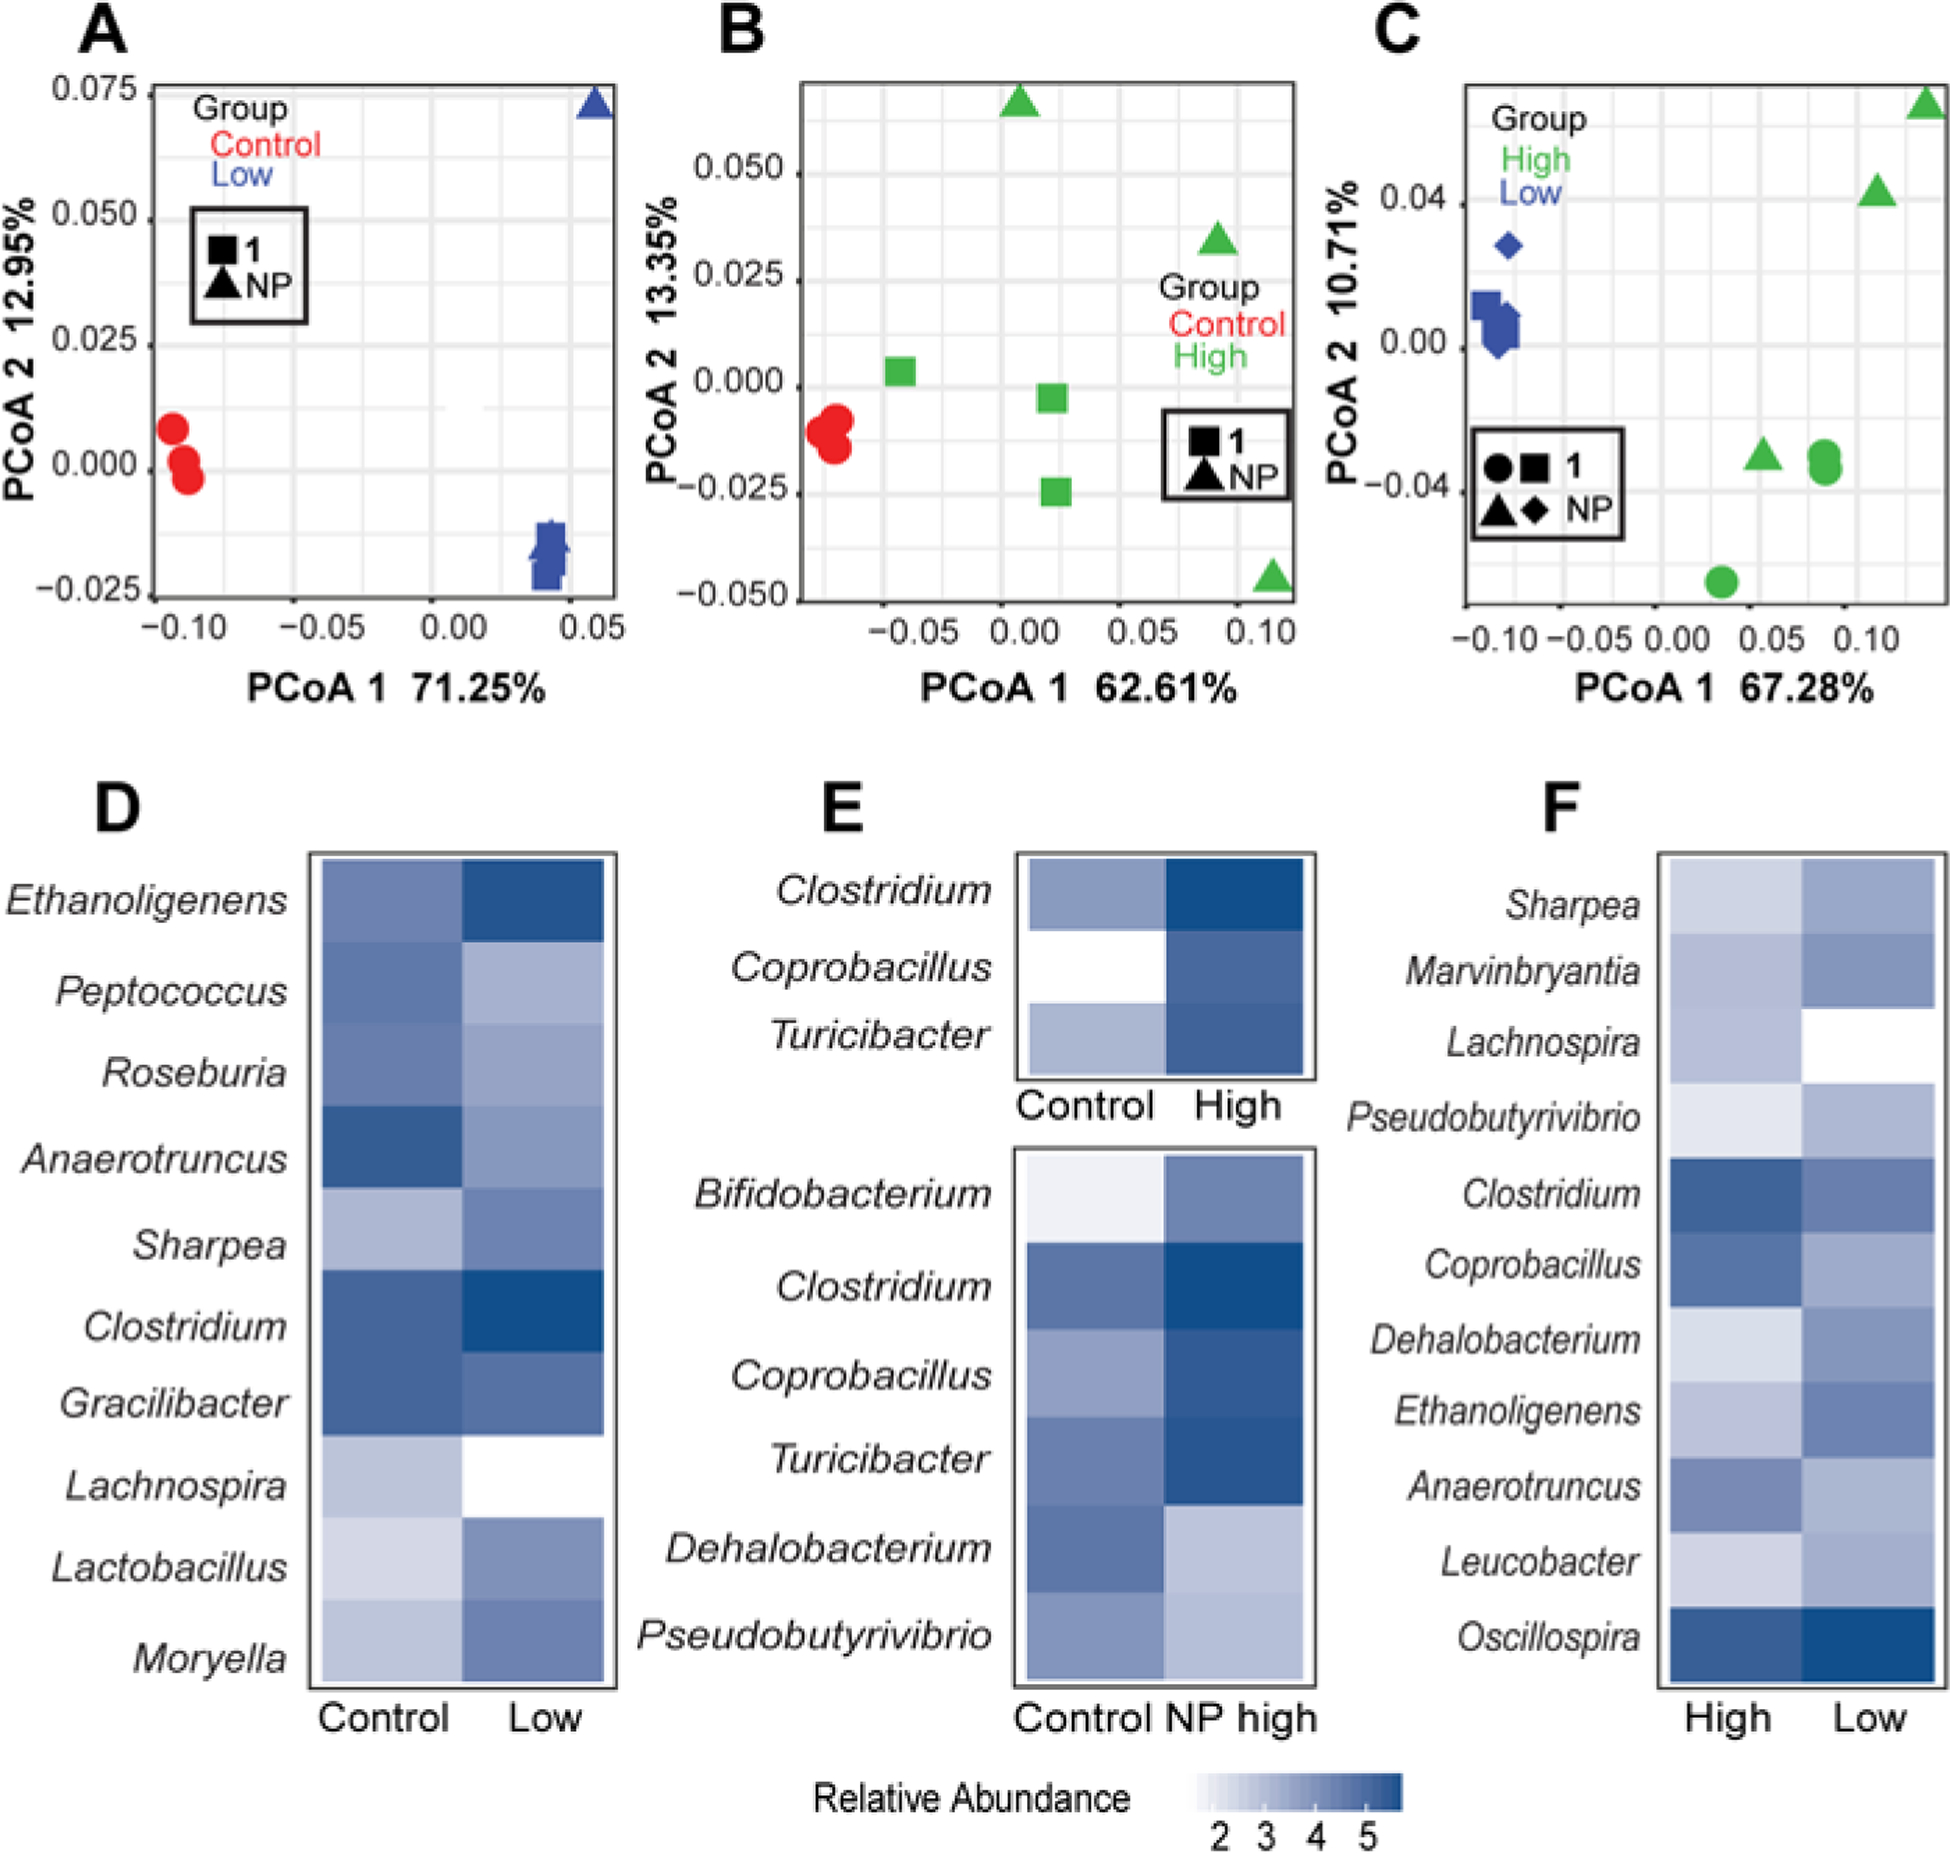
Fig. 7.

Analysis of the microbiome in the large intestines using 16S sequences extracted from RNA-seq data. The extract and cymopol administration changed the composition of mouse gut microbiota. PCoA analysis using QIIME close-reference OTUs generated from the forward reads shows significant shift in microbial composition between (A) control and low groups PCoA1 FDR p =1.0E-08, (B) control and high groups, PCoA1 FDR p = 0.04 and (C) high and low groups, PCoA1 FDR p = 2.8e-06. Heatmaps showing the mean log10 normalized relative abundances of genera that were significantly different (FDR p < 0.05) between (D) control and low groups, (E) control and high groups and (F) high and low groups.
