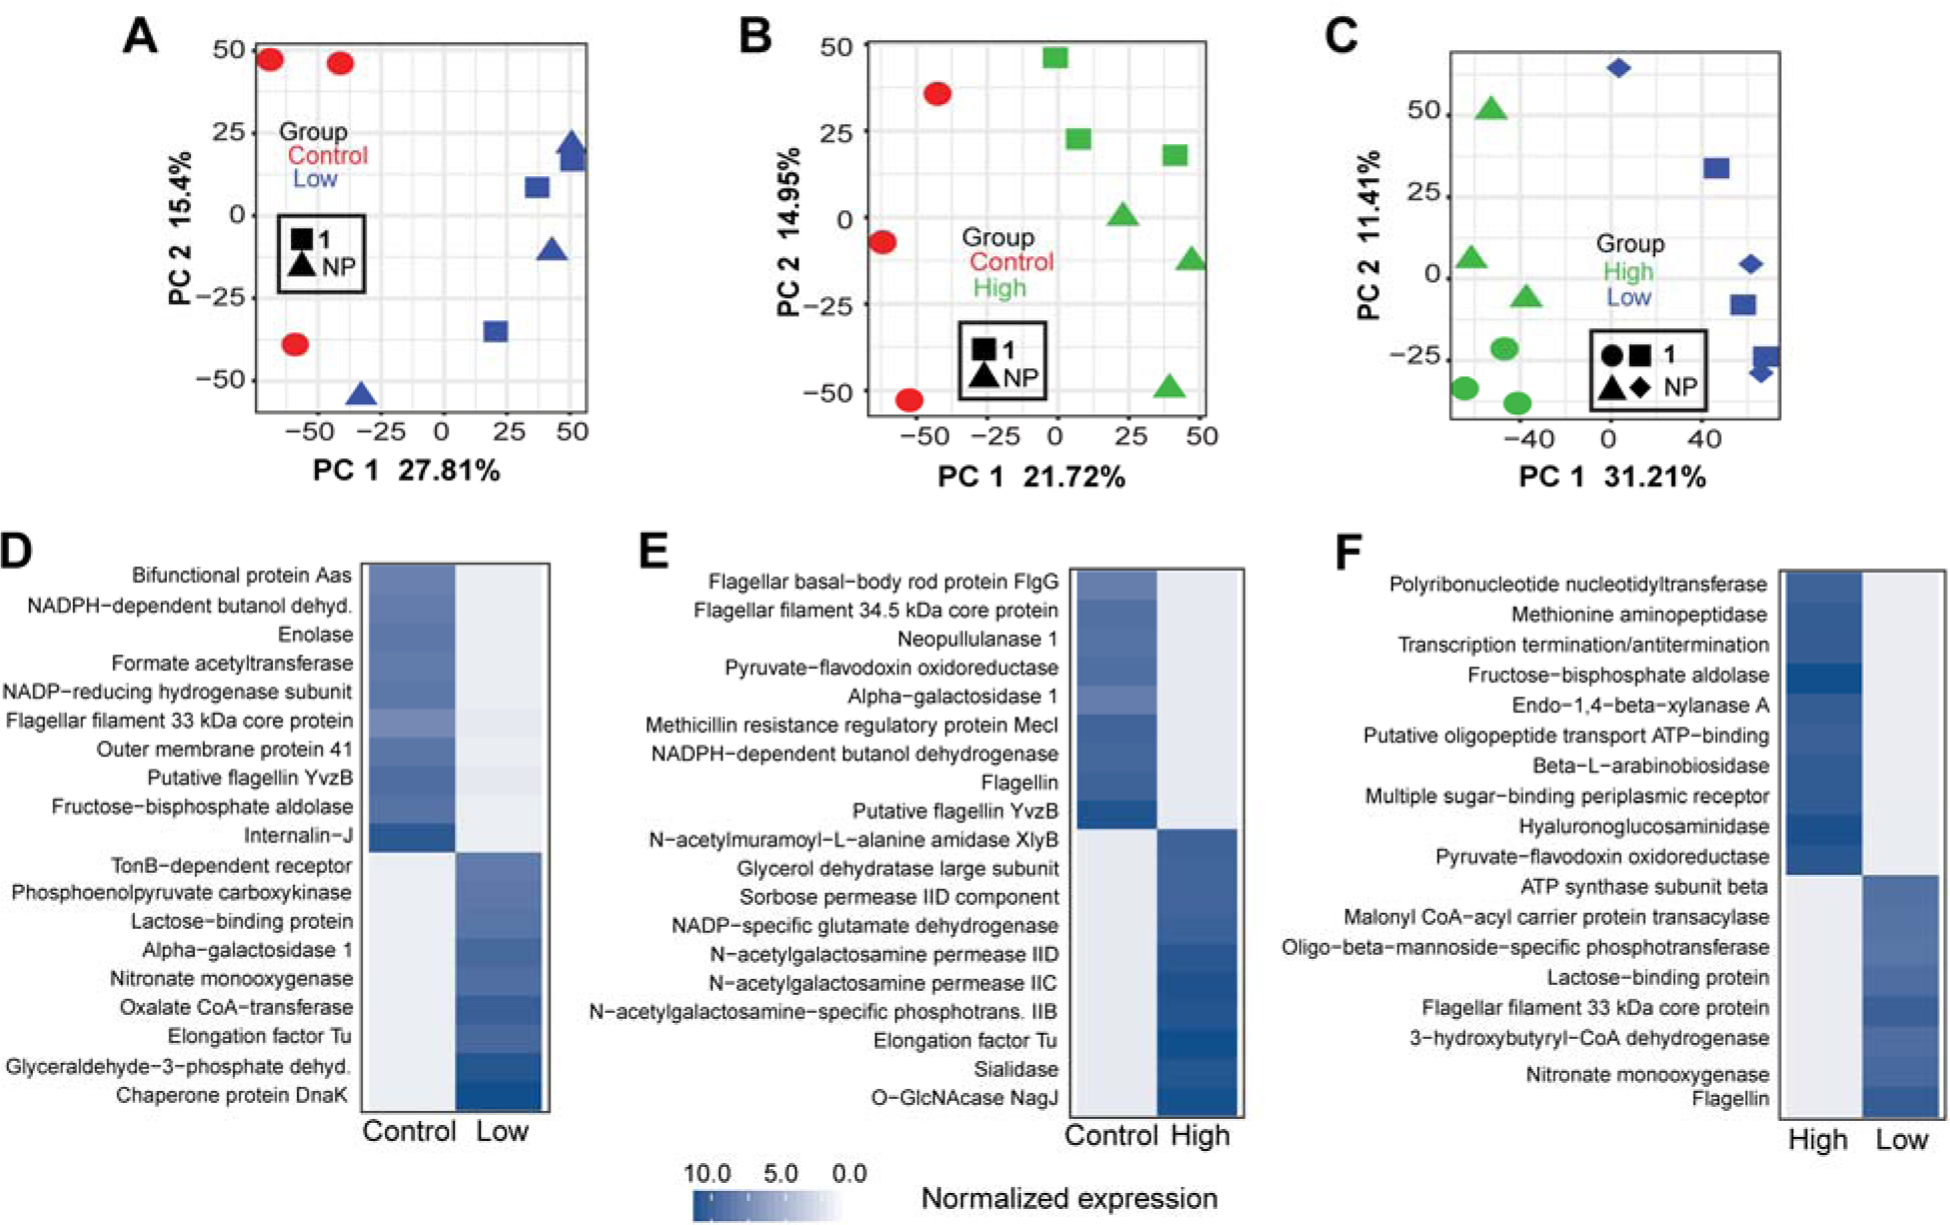
Fig. 8.

Analysis of the microbial gene expression in the large intestines using microbial transcripts extracted from RNA-seq data. The extract and cymopol administration changed gene expression profile for mouse gut microbiota. PCA analysis of microbial gene expression shows significant changes in microbial gene expression between (A) control and low groups PC1 FDR p = 0.01, (B) control and high groups, PC1 FDR p = 0.001 and (C) high and low groups, PC1 FDR p = 9.1E-06. Heatmaps showing the mean log2 edgeR normalized gene expression of representative significantly differentially (FDR p < 0.05) expressed genes between (D) control and low groups, (E) control and high groups, control and NP high groups and (F) high and low groups.
