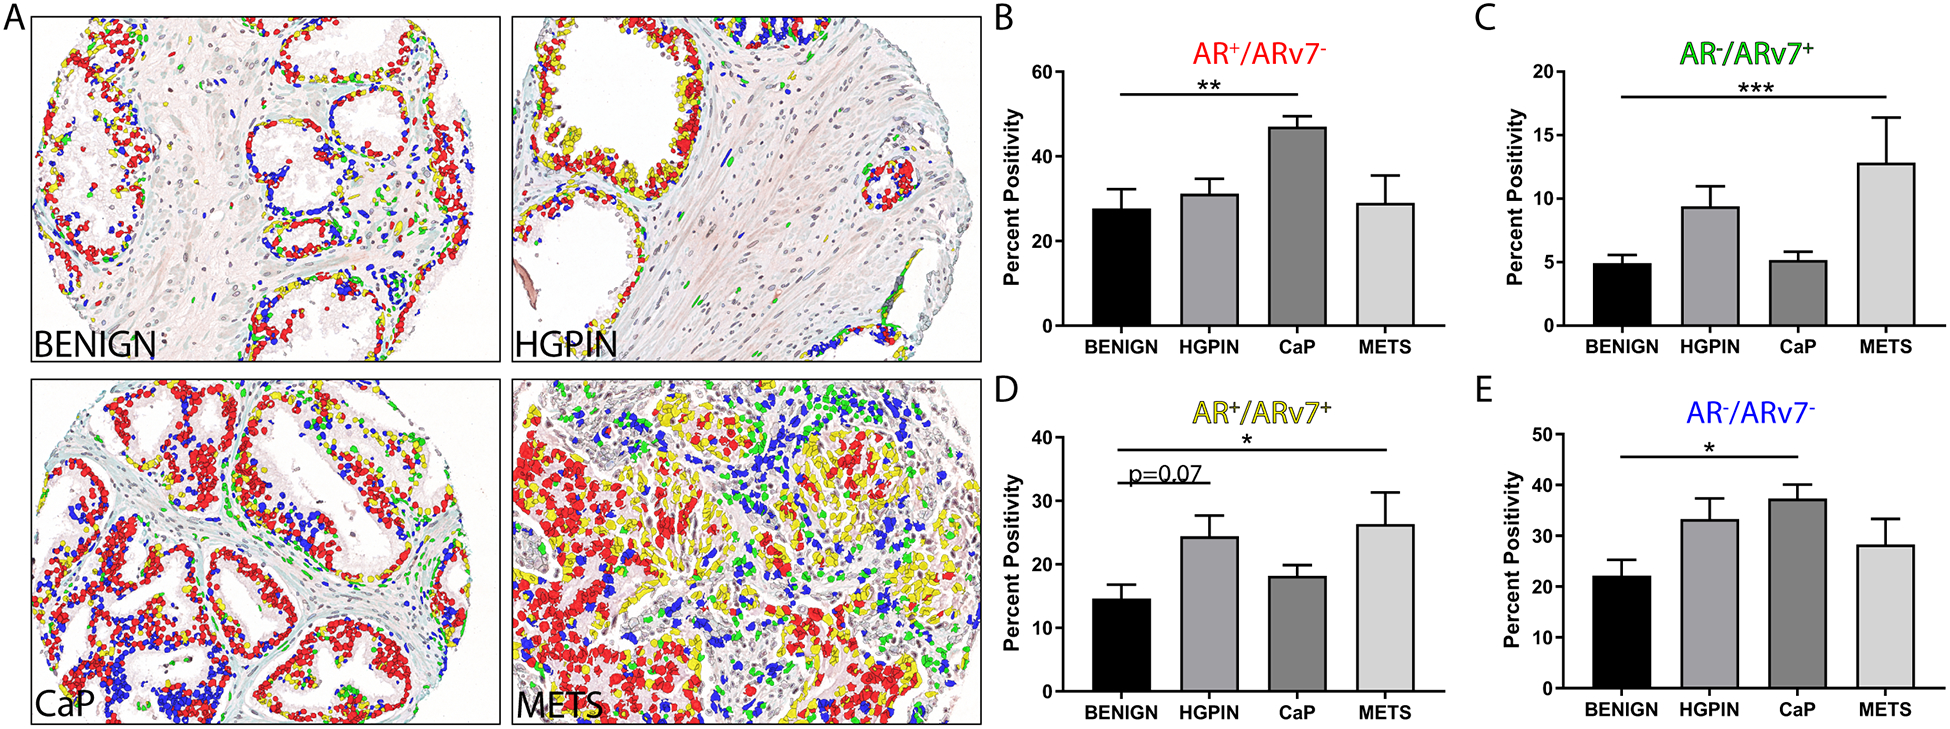
FIGURE 4. AR and ARv7 Co-expression in PRCA Progression.

A. Prostate composite images show AR+/ARv7− nuclei (red), AR−/ARv7+ nuclei (green), AR+/ARv7+ nuclei (yellow), and AR−/ARv7− nuclei (blue) at all stages of PRCA progression.
B. Quantification of the AR+/ARv7− population (red) shows a significant increase in PRCA compared to BENIGN (p<0.01).
C. Quantification of the AR−/ARv7+ population (green) shows a significant increase in METS compared to BENIGN (p<0.001).
D. Quantification of the AR+/ARv7+ population (yellow) shows a significant increase in METS compared to BENIGN (p<0.05), and a slight increase in HGPIN compared to BENIGN (p=0.07).
E. Prostate composite images show AR−/ARv7− nuclei (blue) shows a significant increase in PRCA compared to BENIGN (p<0.05).
