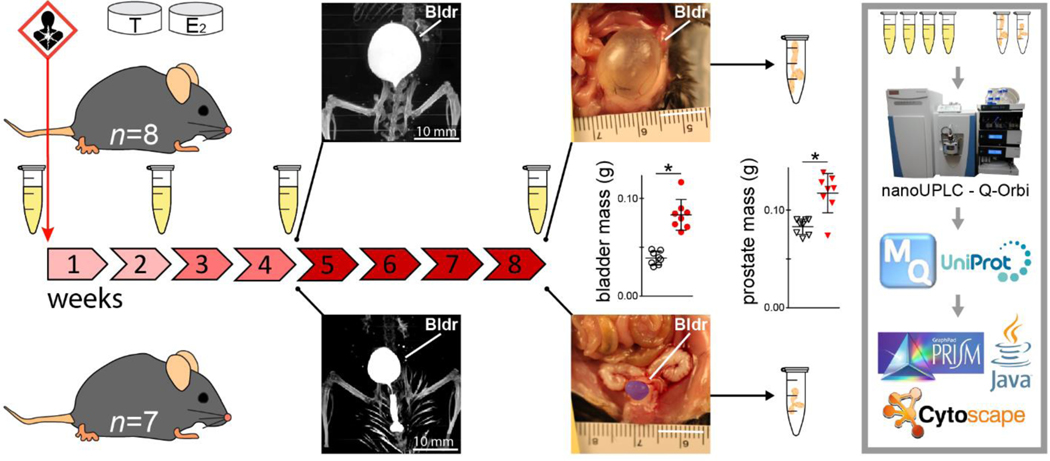
Figure 1.
Experimental design and spatiotemporal proteomics workflow. Urine samples were collected from hormone-treated mice at 4 time points: before treatment and across the development of hormone-induced bladder outlet obstruction. Bladder (Bldr) outlet obstruction was apparent by the week 4 time point via μCT imaging and marked bladder enlargement was observed at 8 weeks (control pseudocolored purple). Bladder and prostate masses at 8 weeks were significantly increased due to hormone treatment (*Student’s t-test p < 0.05). Prostate tissues were collected from hormone-treated (n = 8) and control (n = 7) mice after week 8 urine collection. All urine and prostate tissue samples were analyzed for global proteomics with relative quantification via nanoUPLC-Q-Orbi.

