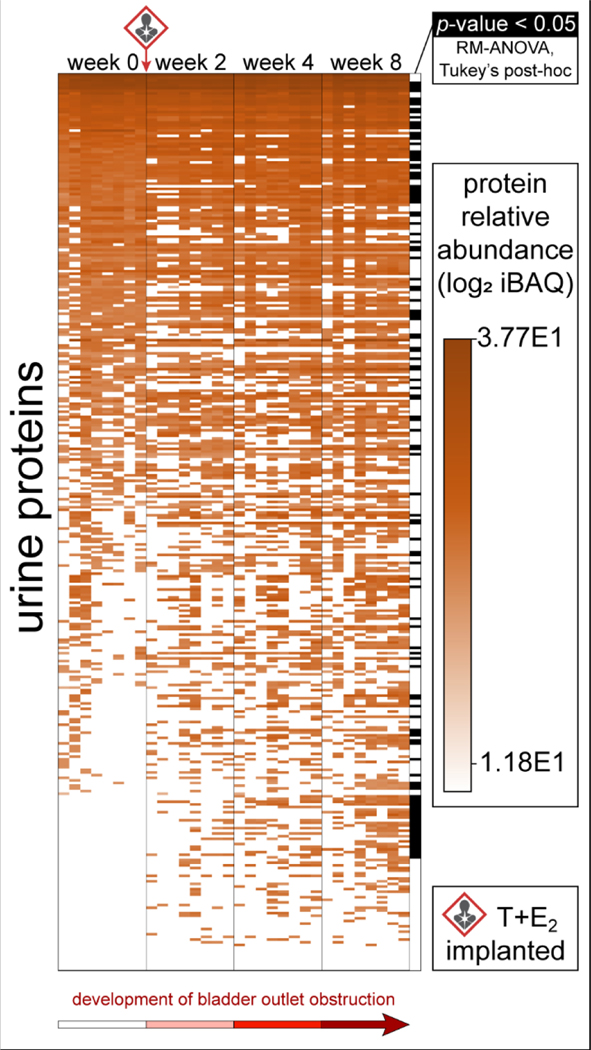
Figure 2.
Urine protein changes in hormone-treated mice across the development of bladder outlet obstruction. Heatmap of the relative protein abundance of 338 total urine protein identifications across 4 treatment time points (n = 8 mice); 120 of these were significantly modulated (n = 8; RM-ANOVA, Tukey’s post-hoc test, α = 0.05).

