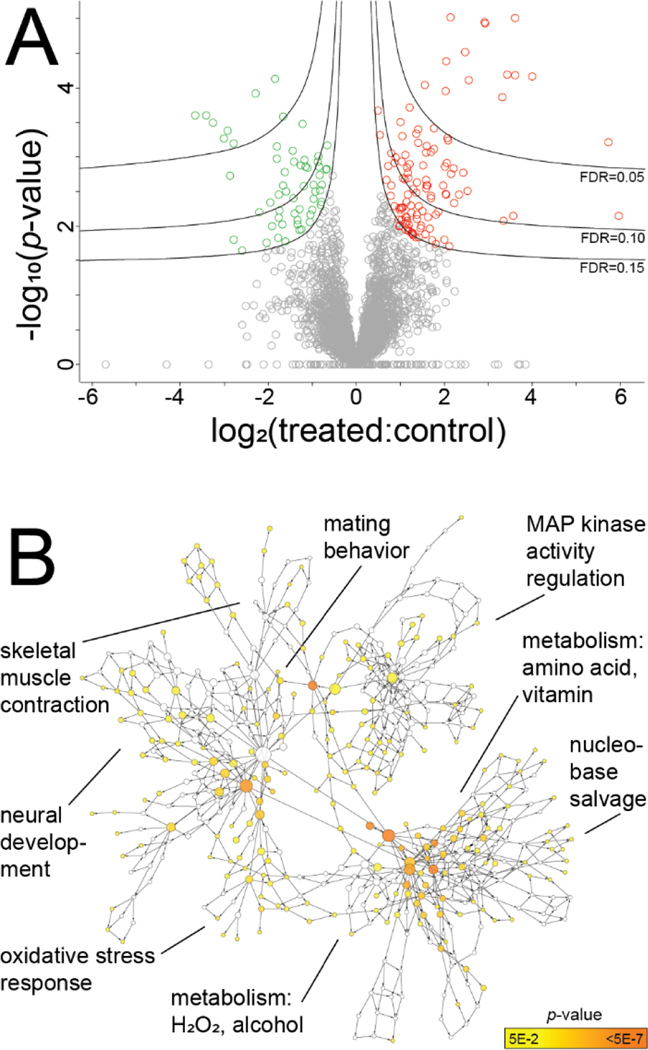
Figure 4.
Prostate tissue proteomics of hormone-treated (n = 8) vs control mice (n = 7). A: Volcano plot of 3849 total prostate proteins, 115 of which were significantly modulated (Student’s t-test p < 0.05 and FDR = 0.15). B: Significantly enriched biological processes among these modulated proteins include the oxidative stress response, metabolism of hydrogen peroxide (H2O2), among others (Hypergeometric test with Benjamini & Hochberg FDR correction; Cytoscape BiNGO tool).

