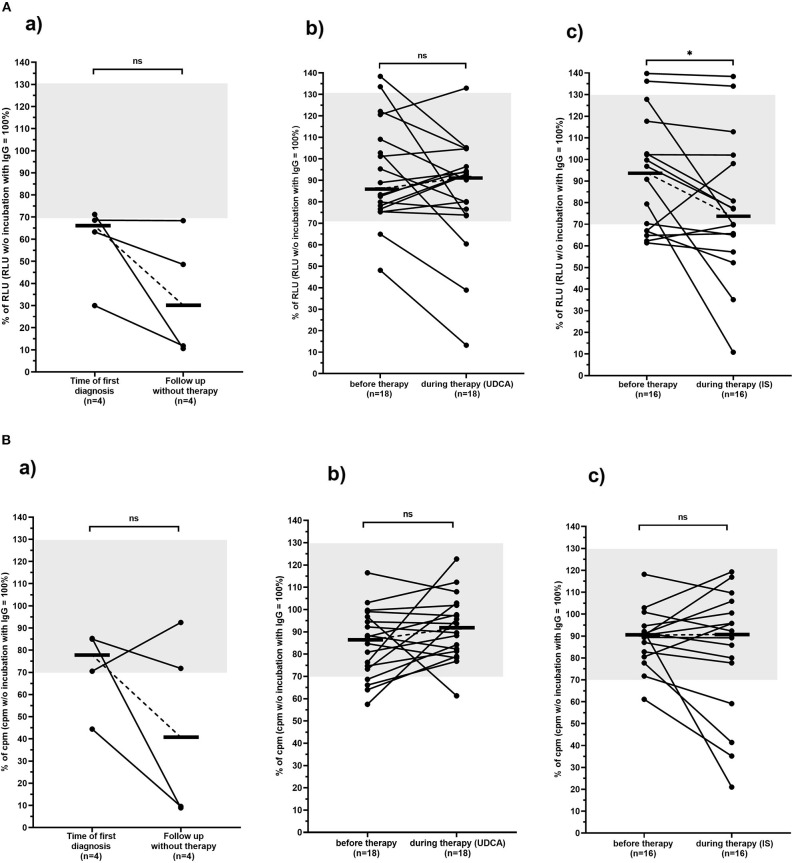
Figure 3.
Carbachol-induced [Ca2+] signal in the mAChR3 functional assay (A) and proliferation (B) of CHO/G5A cells overexpressing mAChR3 after incubation of immunoglobulins from PBC patients before therapy and in the follow-up (a) without any therapy, (b) during therapy with UDCA, and (c) during therapy with immunosuppressive therapy. Data are given as percentage of the RLUs (A) or counts per minute (cpm) (B) w/o incubation with immunoglobulins. –, median; gray, normal range; n.s., not significant; *significant decrease (P < 0.05).

