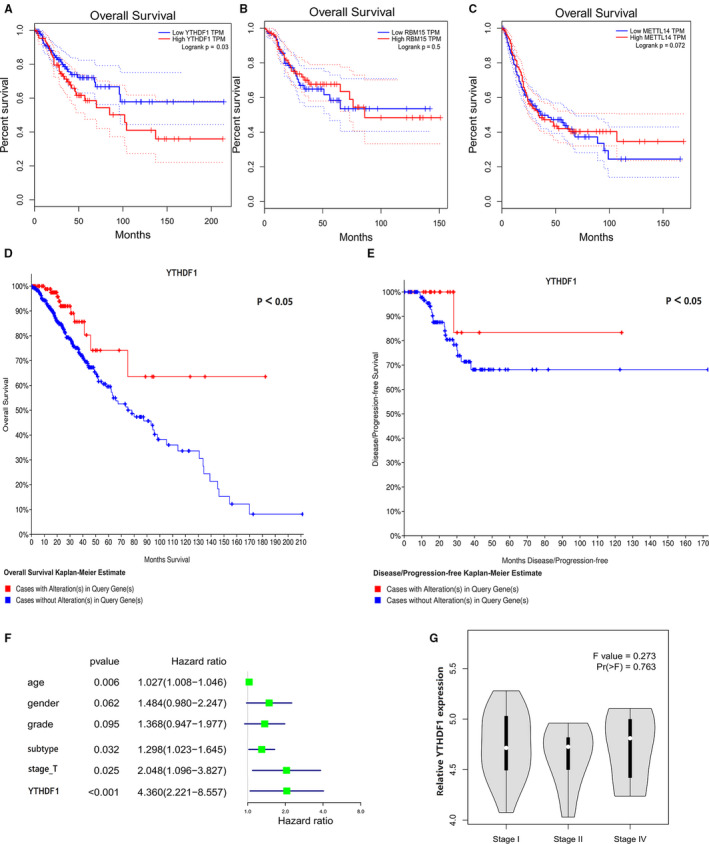
Figure 2.

A‐C, The overall survival (OS) curve of YTHDF1, METTL3 and FTO was performed firstly on Kaplan‐Meier Plotter Database. The overall survival (D) and disease‐free (E) survival of the YTHDF1 mutations on glioma were performed via the cBioPortal for Cancer Genomics website. F, The high expression levels of YTHDF1 are correlated with advanced stages. G, The multivariate analysis of dimension, subtype, age, grade, stage and YTHDF1 were statistically significant factors for glioma progression. *P < 0.05 versus control
