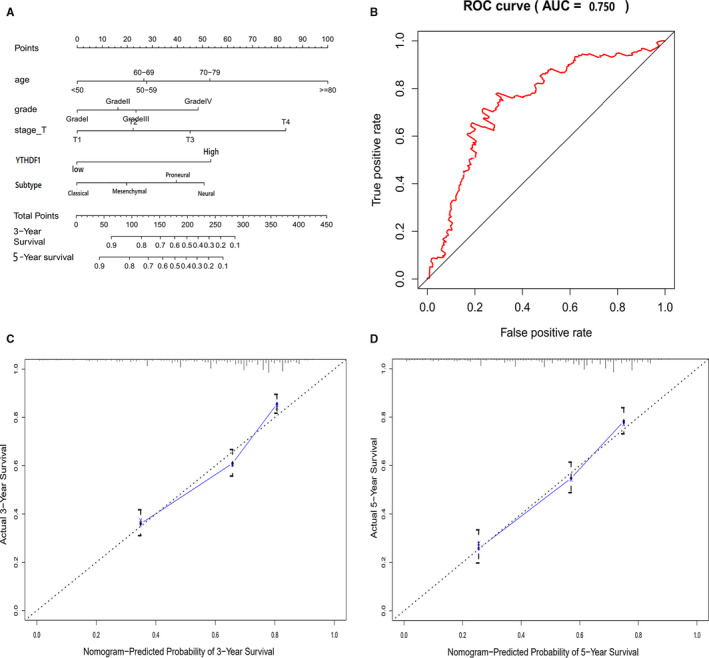
Figure 3.

A, The prognostic nomogram that integrated all significant independent factors from the multivariate analysis for OS in the training cohort. B, The ROC curve area evaluating the prognostic nomogram for OS prediction was 0.750 (95% CI, 0.729 to 0.759). C, The calibration plot for the probability of survival at 3 or 5 years after surgery showed an optimal agreement between the prediction by the nomogram, respectively. *P < 0.05 versus control
