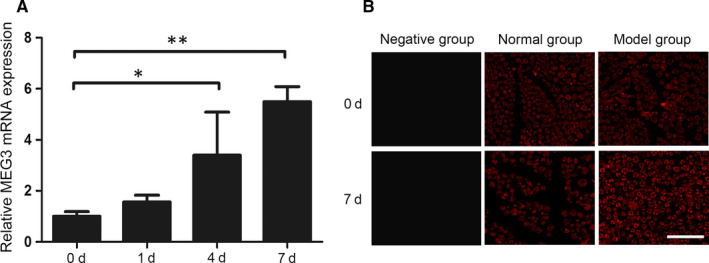
FIGURE 1.

Expression and localization of MEG3 in nerve tissues. A, Detection of MEG3 expression after sciatic nerve injury at 0, 1, 4 and 7 d by qRT‐PCR, n = 6. B, Detection of MEG3 expression in sciatic nerve sections at 0 and 7 d after nerve injury by FISH. Negative group: negative probe; Normal group: normal rat sciatic nerve; Model group: injured rat sciatic nerve, n = 3. Scale bar = 50 μm. Values are presented as mean ± SEM. *P < 0.05, **P < 0.01
