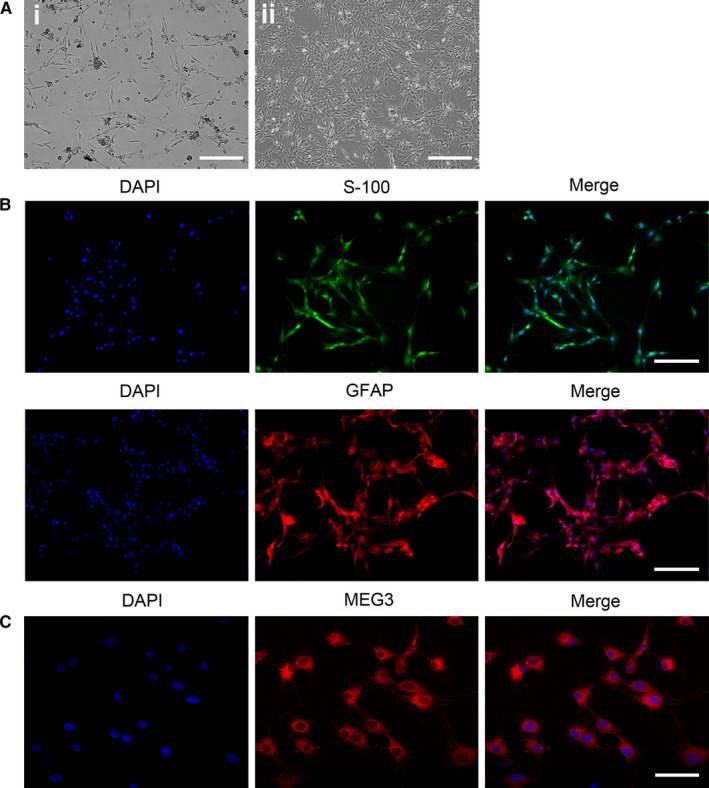
FIGURE 2.

Localization of MEG3 in SCs. A, Morphology of SCs (passages 0 and 5) observed using a light microscope (Ai: Scale bar = 100 μm; Aii: Scale bar = 200μm). B, Images of S‐100 (green) and GFAP (red) antibody staining for SC identification. Nuclei were stained with DAPI (blue), Scale bar = 100 μm. C, Localization analysis of MEG3 by FISH experiment. Nuclei were stained with DAPI (blue). Scale bar = 50 μm
