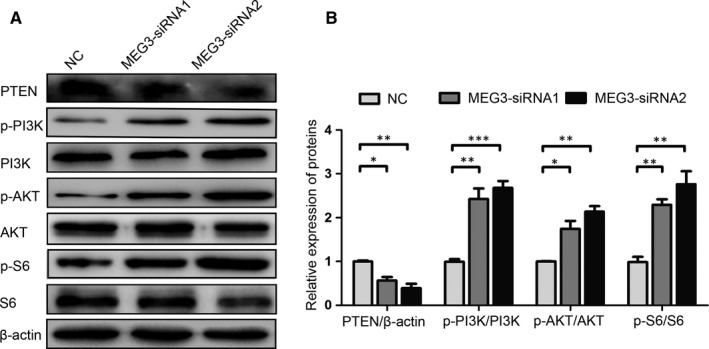
FIGURE 4.

MEG3 regulates the PTEN/PI3K/AKT signalling in primary SCs. Western blot analysis of PTEN, p‐PI3K, PI3K, p‐AKT, AKT, p‐S6 and S6 expression levels after MEG3 siRNA transfection in SCs. A, Representative blot. B, Bar graph of the relative expression level of proteins. Values are obtained from three independent experiments and presented as mean ± SEM. *P < 0.05, **P < 0.01, ***P < 0.001
