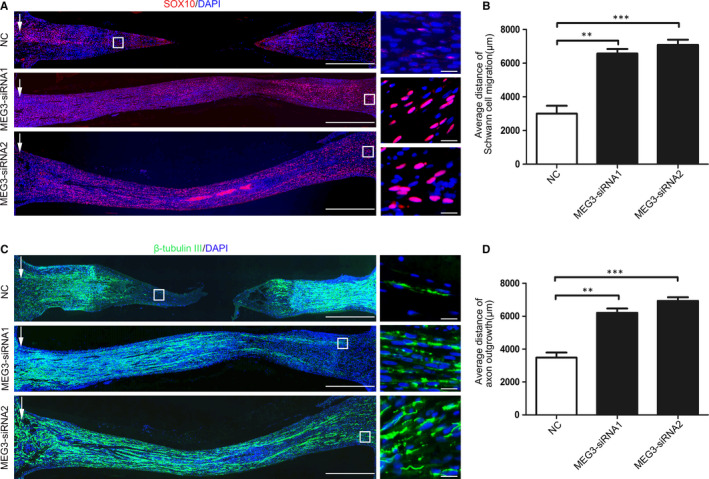
FIGURE 5.

MEG3 affects Schwann cell migration and axon outgrowth in rats after sciatic nerve transection. A, Immunofluorescence detection of the migration distance of Schwann cells in the MEG3‐siRNA and control groups. Red and blue colours represent SOX10‐positive Schwann cells and cell nuclei, respectively. The white arrow represents the edge of the proximal stump and the distance of Schwann cell migration from the edge of the proximal stump (white box), bar = 1000 μm. The image on the right represents the high‐magnification image in the white box on the left, bar = 50 μm. B, Quantitative results showing the average migration distance of Schwann cells, n = 3. C, Images of β‐Tubulin III antibody staining (green) for the detection of regenerated axons. Nuclei were stained with DAPI (blue). The white arrow represents the edge of the proximal stump and the end of axon outgrowth (white box), bar = 1000 μm. The image on the right represents the high‐magnification image in the white box on the left, bar = 50 μm. D, Quantitative results showing average distance of axon outgrowth in silicone conduits, n = 3. Values are presented as mean ± SEM. **P < 0.01, ***P < 0.001
