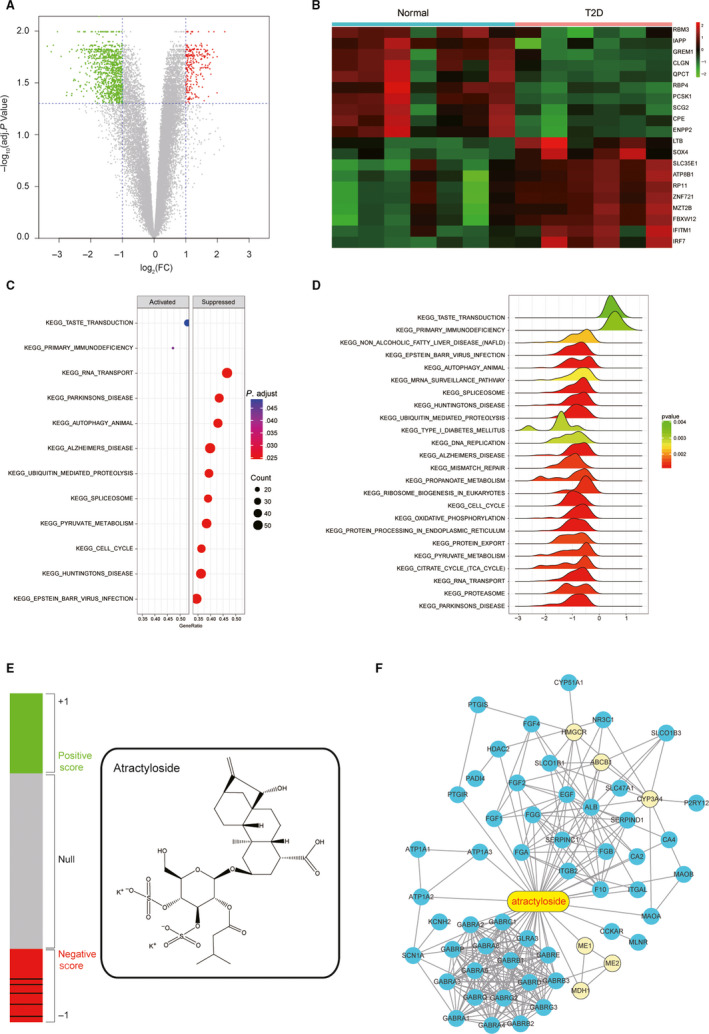
Figure 2.

Transcriptomic analysis results indicated differentially expressed genes and pathways between healthy volunteer and T2D patients, and the CMap analysis results indicated that Atractyloside might have the treatment effect to T2D. A, Volcano plot indicated that 774 differentially expressed genes (DEGs) were screened in T2D patients in the accordance with Gene Expression Omnibus (GEO) database. Threshold was set to be log2|FC| > 1 and P < .05. B, Heat map revealed the differences of gene expression between T2D patients (Case) and the healthy volunteers (Normal). C, The dotplot illustrated the top 12 altered pathways that could lead to metabolic disorders or the occurrence of T2D. D, The joyplot indicated the top 24 altered pathways, and thereinto 2 were activated in T2D while the rest were suppressed. E, The left bar graphs reveal the Connectivity Score data of Atractyloside in the GSE25724. Lines in each colour sections represent each instance performed with the respective compound. The rounded rectangle structure of Atractyloside was illustrated in the right. F, A network of potential genes which atractyloside might target to. Six genes in yellow circle were the differentially expressed genes screened from transcriptomic data, including malic enzyme 1 (ME1), malic enzyme 2 (ME2), malate dehydrogenase 1 (MDH1), 3‐hydroxy‐3‐methylglutaryl‐CoA reductase (HMGCR), ATP binding cassette subfamily B member 1 (ABCB1) and cytochrome P450 family 3 subfamily A member 4 (CYP3A4)
