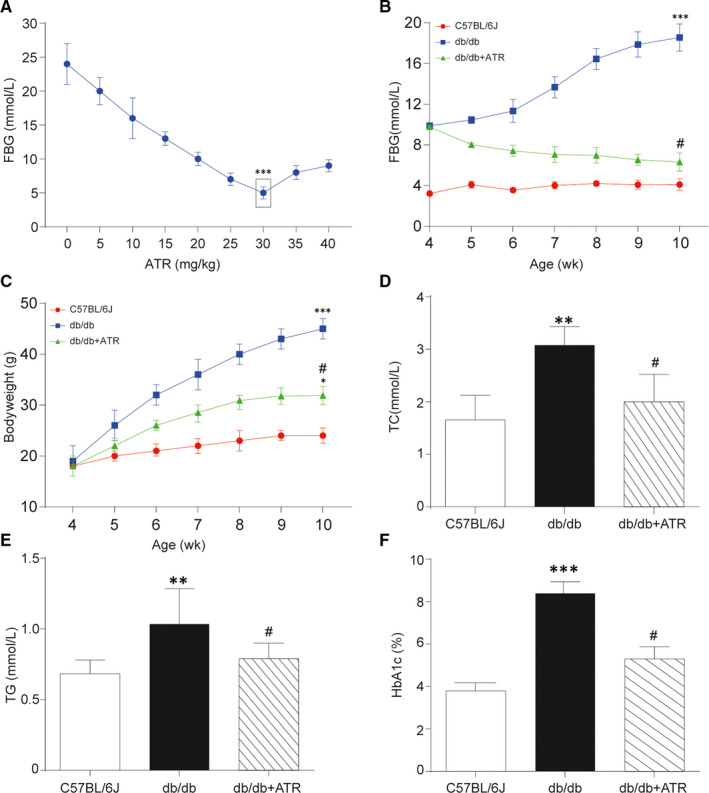
Figure 3.

Measurement of bodyweight and serum biochemical parameters in each mice group. A, The change curve of fasting blood glucose (FBG) went along with different doses of Atractyloside. With 30 mg/kg ATR treatment, FBG got the lowest in T2D group. B, Glucose tolerance test of each group. FBG of db/db mice treated with additional 30 mg/kg ATR was significantly decreased compared with those without treatment in each week, while FBG of C57BL/6J mice remained in a low level at around 4 mmol/L. C, Bodyweight of mice in each group. The increasing of bodyweight in db/db mice compared with C57BL/6J group was suppressed with additional ATR treatment. D, Total cholesterol (TC) level of mice in each group. TC in db/db mice was much higher than that in C57BL/6J group, which was relieved in db/db mice treated with ATR. E, Triglyceride (TG) level of mice in each group. TC in db/db mice was increased compared with C57BL/6J group, which was relieved with additional ATR treatment. F, Plasma glycated haemoglobin (HbA1c) of mice in each group. The level of HbA1c was remarkably increased in db/db mice compared with C57BL/6J mice and got repressed after ATR treatment. Data = mean ±SD, n = 5 in each group, *P < .05, **P < .01, ***P < .001, compared with NC (C57BL/6J) group. # P < .05, ## P < .01, compared with db/db group
