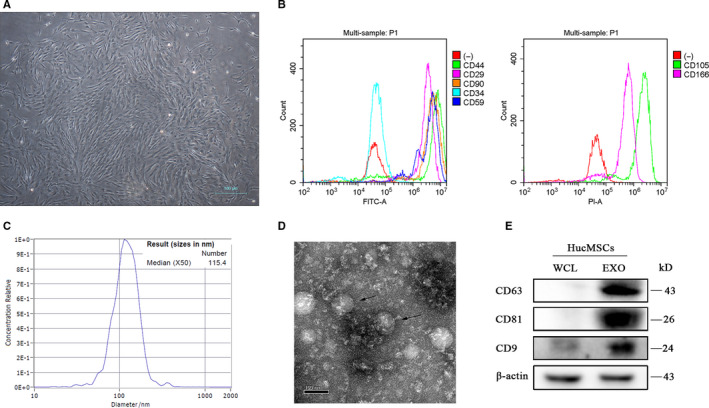
Figure 1.

Identification of hucMSCs and hucMSC‐exosomes. A, The phase morphology of isolated hucMSCs. Scale bar, 100 μm. B, Flow cytometry analysed the expressions of MSC surface markers. C, The size distribution of hucMSC‐exosomes using nanoparticle tracking analysis (NTA). D, The size and shape of hucMSCs‐exosomes (black arrows) using transmission electron microscopy (TEM). Scale bar, 100 nm. E, Western blot analysis
