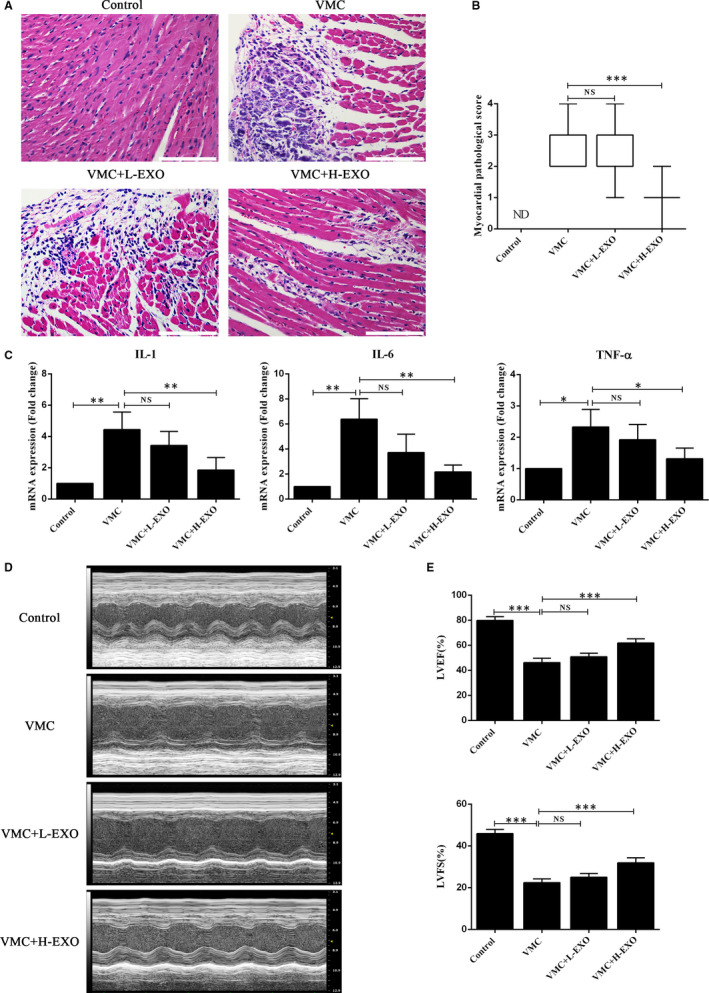
Figure 3.

Effects of hucMSC‐exosomes on the heart function of CVB3‐induced myocarditis. A, H&E staining in the heart tissues. Scale bar, 100 μm. B, The histopathological scores of each group (n = 8). C, The expressions of IL‐1, IL‐6 and TNF‐α in the heart tissues (n = 6) using qPCR assay. D, The typical M‐mode echocardiograms (n = 8). E, The quantitative results of LVEF and LVFS in these four groups. Data were expressed as mean ± SD. NS means no significance differences. *P < 0.05, **P < 0.01, ***P < 0.001 indicate significant differences when compared with control (0.1 mL NS without CVB3) or hucMSC‐exosome treatment (0 μg), respectively
