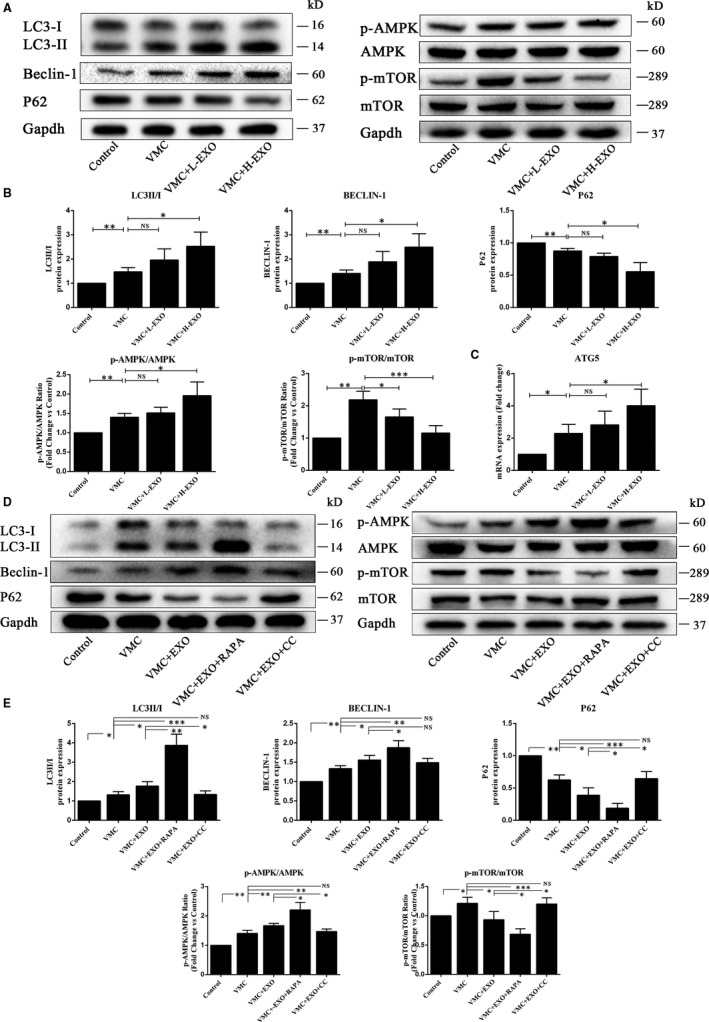
Figure 5.

hucMSC‐exosomes activated autophagy flux in vivo and in vitro. A, Western blot analysis of protein expressions in heart tissues in vivo. B, The quantitative results of Western blot. C, The expression of ATG5 gene in the heart tissues using qPCR assay. D, Western blot analysis of protein expressions in HCMs in vitro. E, The quantitative results of Western blot. Data were expressed as mean ± SD. n = 6. NS means no significance differences. *P < 0.05, **P < 0.01, ***P < 0.001 indicate significant differences when compared with control (0.1 mL NS without CVB3 or 0 MOI CVB3) or hucMSC‐exosome treatment (0 or 50 μg/mL), respectively
