
Figure 1.
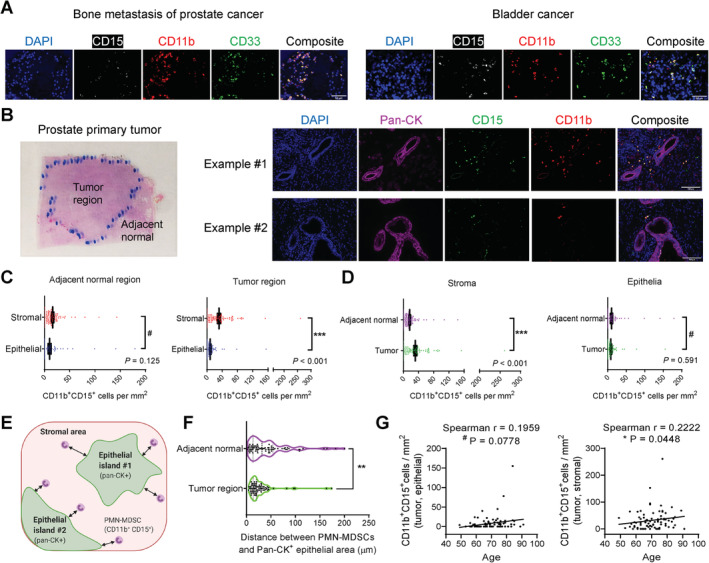
Increased infiltration of CD11b+ CD15+ PMN‐MDSCs in the stromal areas but not epithelial areas of primary prostate tumors. (A) Representative images of bone metastasis of PCa and bladder cancer showing the overlapping staining pattern of CD11b and CD33. Scale bar, 50 μm. (B) Representative image of a prostate tumor section with contours of the tumor and adjacent normal regions drawn by the pathologist, and two representative image sets of primary prostate tumors stained with the CD11b/CD15/pan‐CK/DAPI mIF panel. Scale bar, 100 μm. (C,D) Quantification results of CD11b+CD15+ PMN‐MDSCs. N = 90. Data represent mean ± standard error of the mean (SEM). P values calculated using a negative binomial regression model. (E) Illustration of the definition of epithelial area, stromal area and the distance between PMN‐MDSCs and nearest epithelial edge. (F) Violin plot comparing the distance between PMN‐MDSCs and the nearest epithelial area in the tumor and adjacent normal regions. **p = 0.0011 by Wilcoxon matched‐pair test. (G) Association of stroma‐residing PMN‐MDSCs, but not epithelia‐residing PMN‐MDSCs, in primary tumors with patient age (N = 90), tested by two‐tailed Spearman test.