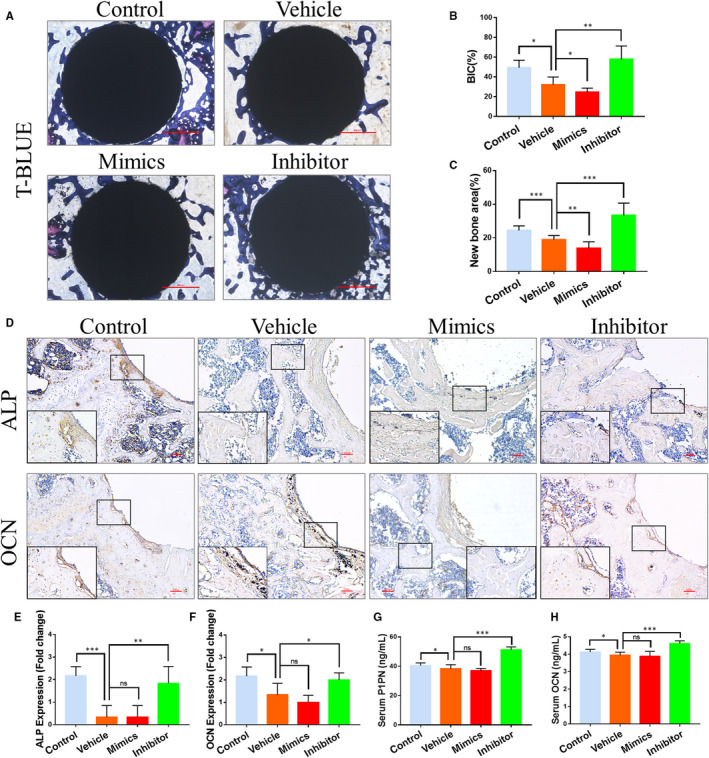
FIGURE 3.

Effects of miR‐106b on osteogenic ability in vivo. A, Representative histological images of Ti rods with toluidine blue stain. Scar bar: 500 μm. B, Average histomorphometric values of BIC and C, quantitative analysis of the new bone area were determined. D, Representative immunohistochemical images of ALP and OCN. Scar bar: 100 μm. E, F, Semi‐quantitative analysis of ALP and OCN expression. G, H, Serum levels of OCN and P1NP in each group. n = 6 per group. *P < .05, **P < .01, ***P < .001
