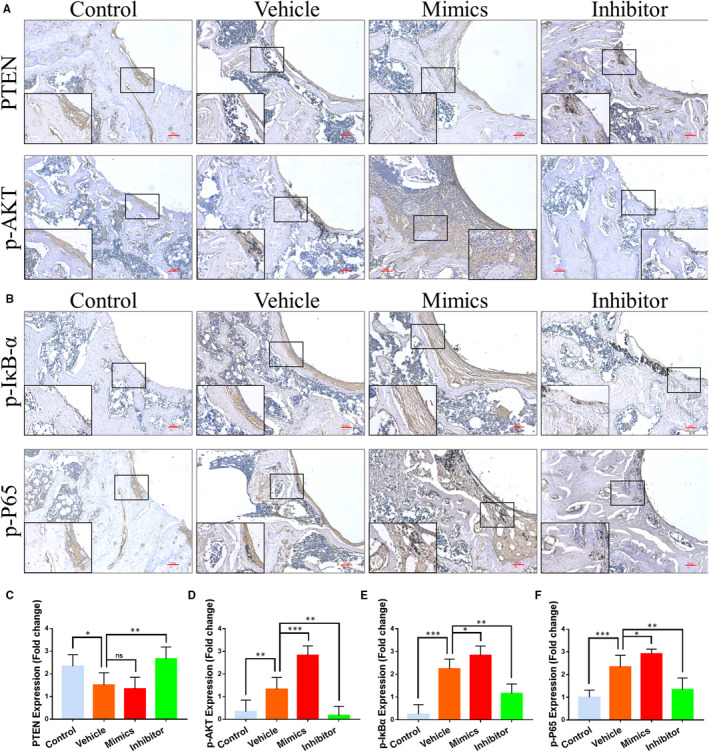
FIGURE 7.

MiR‐106b and the activation of PTEN/PI3K/AKT and NF‐κB signalling pathways in vivo. A, Representative immunohistochemical images of PTEN and p‐Akt. Scar bar: 100 μm. B, Representative immunohistochemical images of p‐IκBα and p‐P65. Scar bar: 100 μm. C‐F, Semi‐quantitative analysis of PTEN, p‐Akt, p‐IκBα and p‐P65 expression. n = 6 per group. *P < .05, **P < .01, ***P < .001
