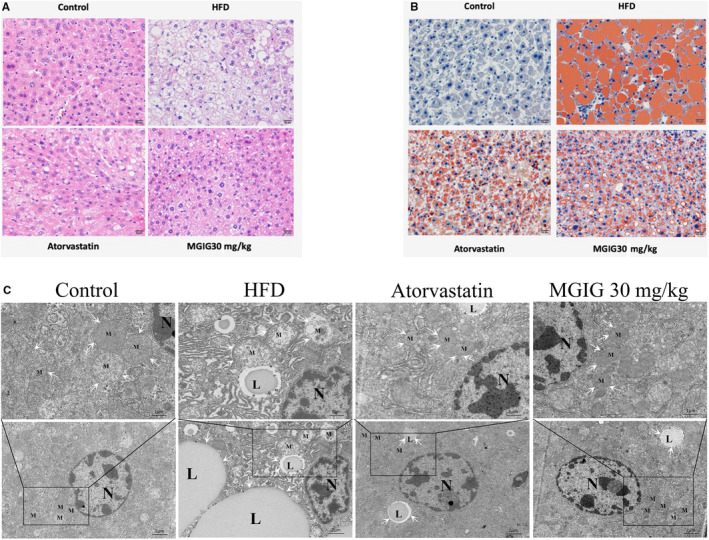
FIGURE 2.

Effects of magnesium isoglycyrrhizinate (MGIG) treatment on high‐fat diet (HFD)‐induced lipid accumulation in livers. Representative photographs of histopathologic changes are presented (A). Representative photographs of Oil Red O staining are presented (B). Ultramicrostuctures of mitochondria and lipid droplets in livers are presented by transmission electron microscopy (C). The data were presented as means ± SDs. Compared with Control group: # P < .05, ## P < .01, ### P < .001. Compared with Model group: *P < .05, **P < .01, ***P < .001 (n = 3)
