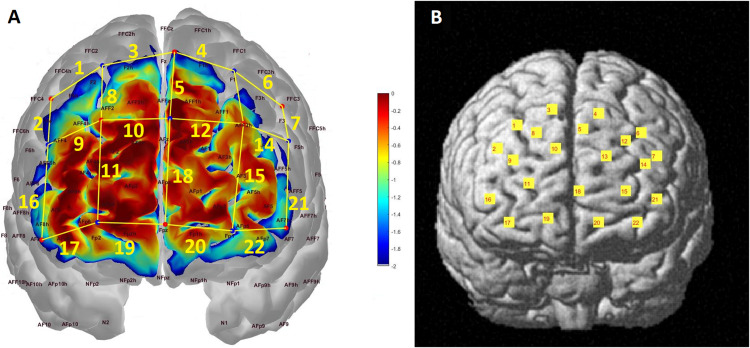
FIGURE 1.
(A) Probe configuration and photon sensitivity profile. Each red dot corresponds to a light source while each blue dot represents a detector. Channels are formed between adjacent source-detector pairs and represented with yellow lines and labeled accordingly. The sensitivity of the probe to detecting brain hemodynamics is presented as a heat map in log10 units. (B) Channel locations projected onto a standard brain template in MNI space.

