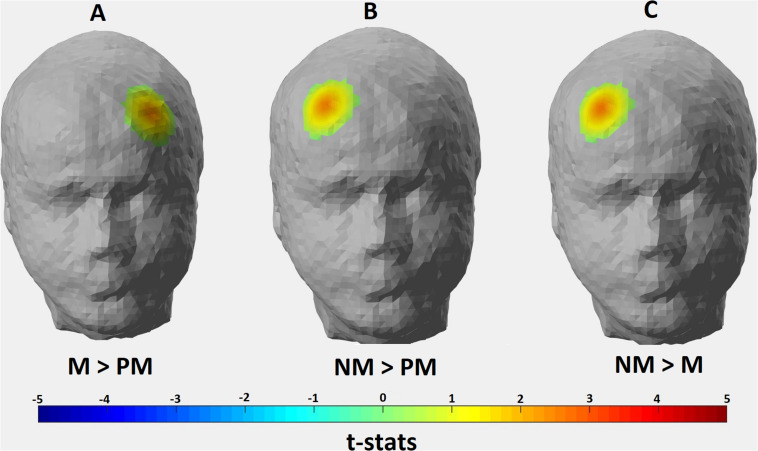
FIGURE 5.
Hemodynamic activity strength parameter map depicting the contrasts for (A) Match > Perfect Match; (B) Non Match > Perfect Match; and (C) Non Match > Match conditions. Channels depicting statistically significant contrast (p > 0.05) were mapped onto a standard head model with their thresholded t-statistics score for each condition pair.

