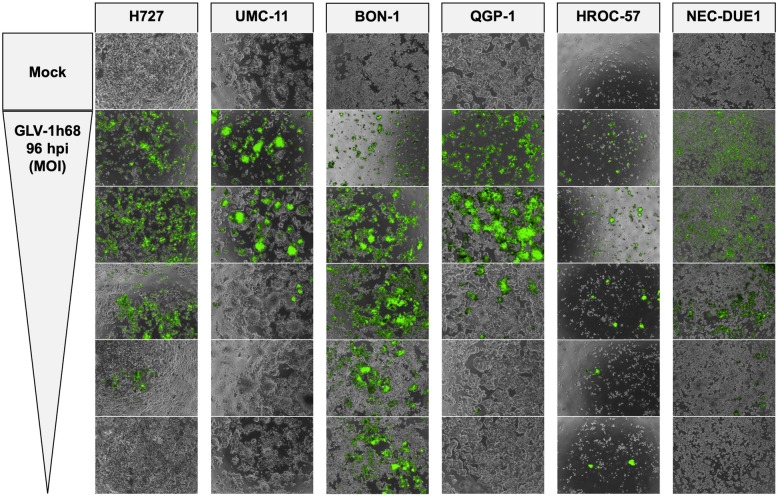
Fig. 2.
Microscopy of viral transgene expression. Fluorescence microscopy of the NET/NEC panel infected with oncolytic vaccinia virus vector GLV-1 h68. Phase contrast and fluorescence pictures were taken at 96 hpi and overlaid. From top to bottom, MOIs decrease and match the MOIs used in the respective SRB viability assays (Fig. 1). When using higher MOIs, infected cells displayed higher transgene expression. In BON-1, HROC-57, and QGP-1 cells, being highly permissive or permissive to GLV-1 h68 oncolysis, tumor cell killing already had been accomplished at 96 hpi resulting in lower GFP signals using high MOIs. No viral transgene expression could be observed in mock samples

