Fig. 4.
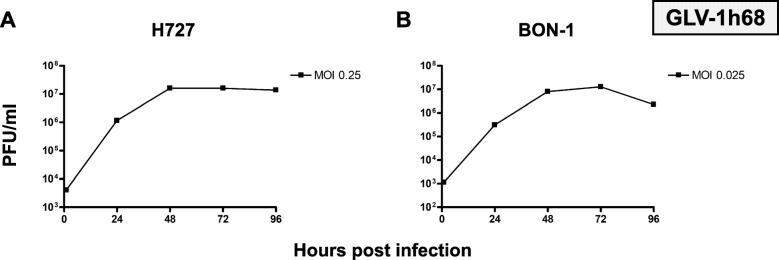
Virus quantification of OV monotherapy. Virus titer growth curves performed for oncolytic vaccinia virus vector GLV-1 h68 using representative NET cell lines of lung (H727) and pancreatic (BON-1) origin. For both cell lines, a 10,000-fold rise in viral titers could be observed during the first 48 h and titers higher than 107 PFU/ml were reached. Then, viral growth was found to stagnate, being due to oncolytic reduction of virus host cell counts. Plaque forming units (PFU) were determined every 24 h; samples were analyzed in duplicates; experiments were performed twice; one representative result is shown

