
Fig. 2. GluRδ2 protein insufficiency in mice recapitulates ET-like CF synaptic pathology.
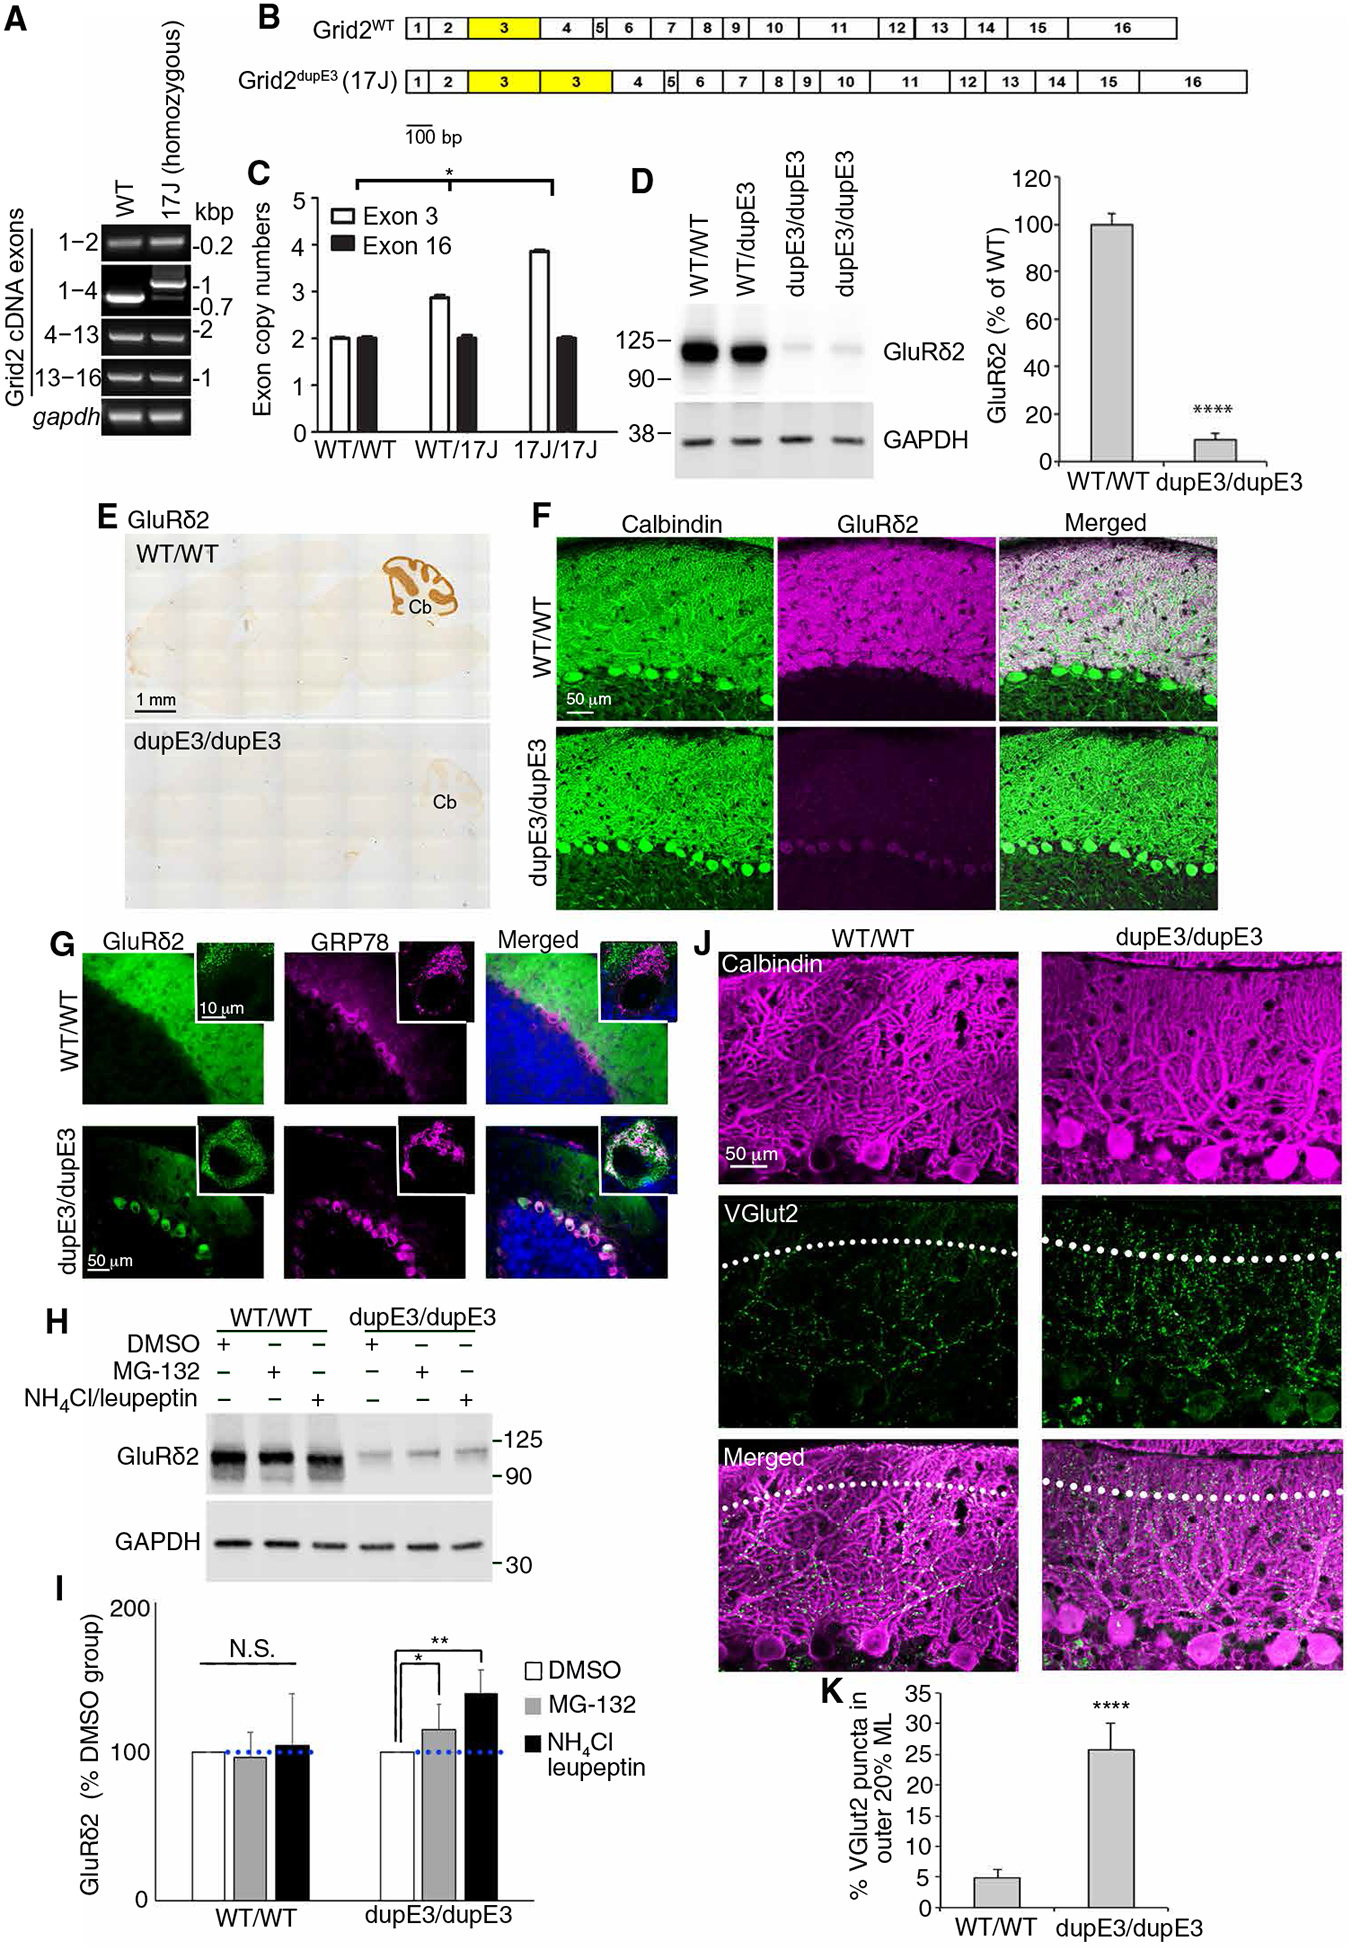
(A) RT-PCR of the cerebellar cortex of Grid2 cDNA from hotfoot17J mice. PCR fragments that include exon 3 showed an increase-sized fragment. kbp, kilo base pair. (B) Diagrams of WT and hotfoot17J Grid2 cDNA allele. bp, base pair. (C) Quantitative PCR of genomic DNA of exon 3 and exon 6 of Grid2 gene from WT or homozygous hotfoot17J (Grid2dupE3) mice (n = 3 in each group, Kruskal-Wallis, one-way ANOVA). (D) Western blots of the cerebellar cortex of WT and homozygous hotfoot17J (Grid2dupE3) mice [(D) n = 5 in each group, Student’s t test). (E) Representative images of GluRδ2 immunohistochemistry. (F) Representative images of dual immunofluorescence of calbindin to visualize PCs (green) and GluRδ2 (magenta). (G) Representative images of dual immunofluorescence of GRP78 to visualize endoplasmic reticulum (magenta) and of GluRδ2 (green). (H) Western blots of cerebellar slices incubated with either proteasomal (MG-132) or lysosomal (NH4Cl and leupeptin) inhibition in a WT mouse or a hotfoot17J (Grid2dupE3) mouse and (I) the quantification of GluRδ2 expression [(I) n = 8 in each group, Kruskal-Wallis one-way ANOVA). DMSO, dimethyl sulfoxide. (J) Representative images of dual immunofluorescence of calbindin and VGlut2 in a WT mouse or a Grid2dupE3 mouse. The dotted lines indicate the border between the outer 20% and the inner 80% of the molecular layer. (K) Quantification of the percentage CF synapses in the outer 20% of the molecular layer in WT and Grid2dupE3 mice (n = 8 in each group, Student’s t test). Error bars denote SEM. *P < 0.05, **P < 0.01, and ****P < 0.001. dupE3, Grid2dupE3; WT, wild type.