
Fig. 7. Patients with ET develop excessive cerebellar oscillations.
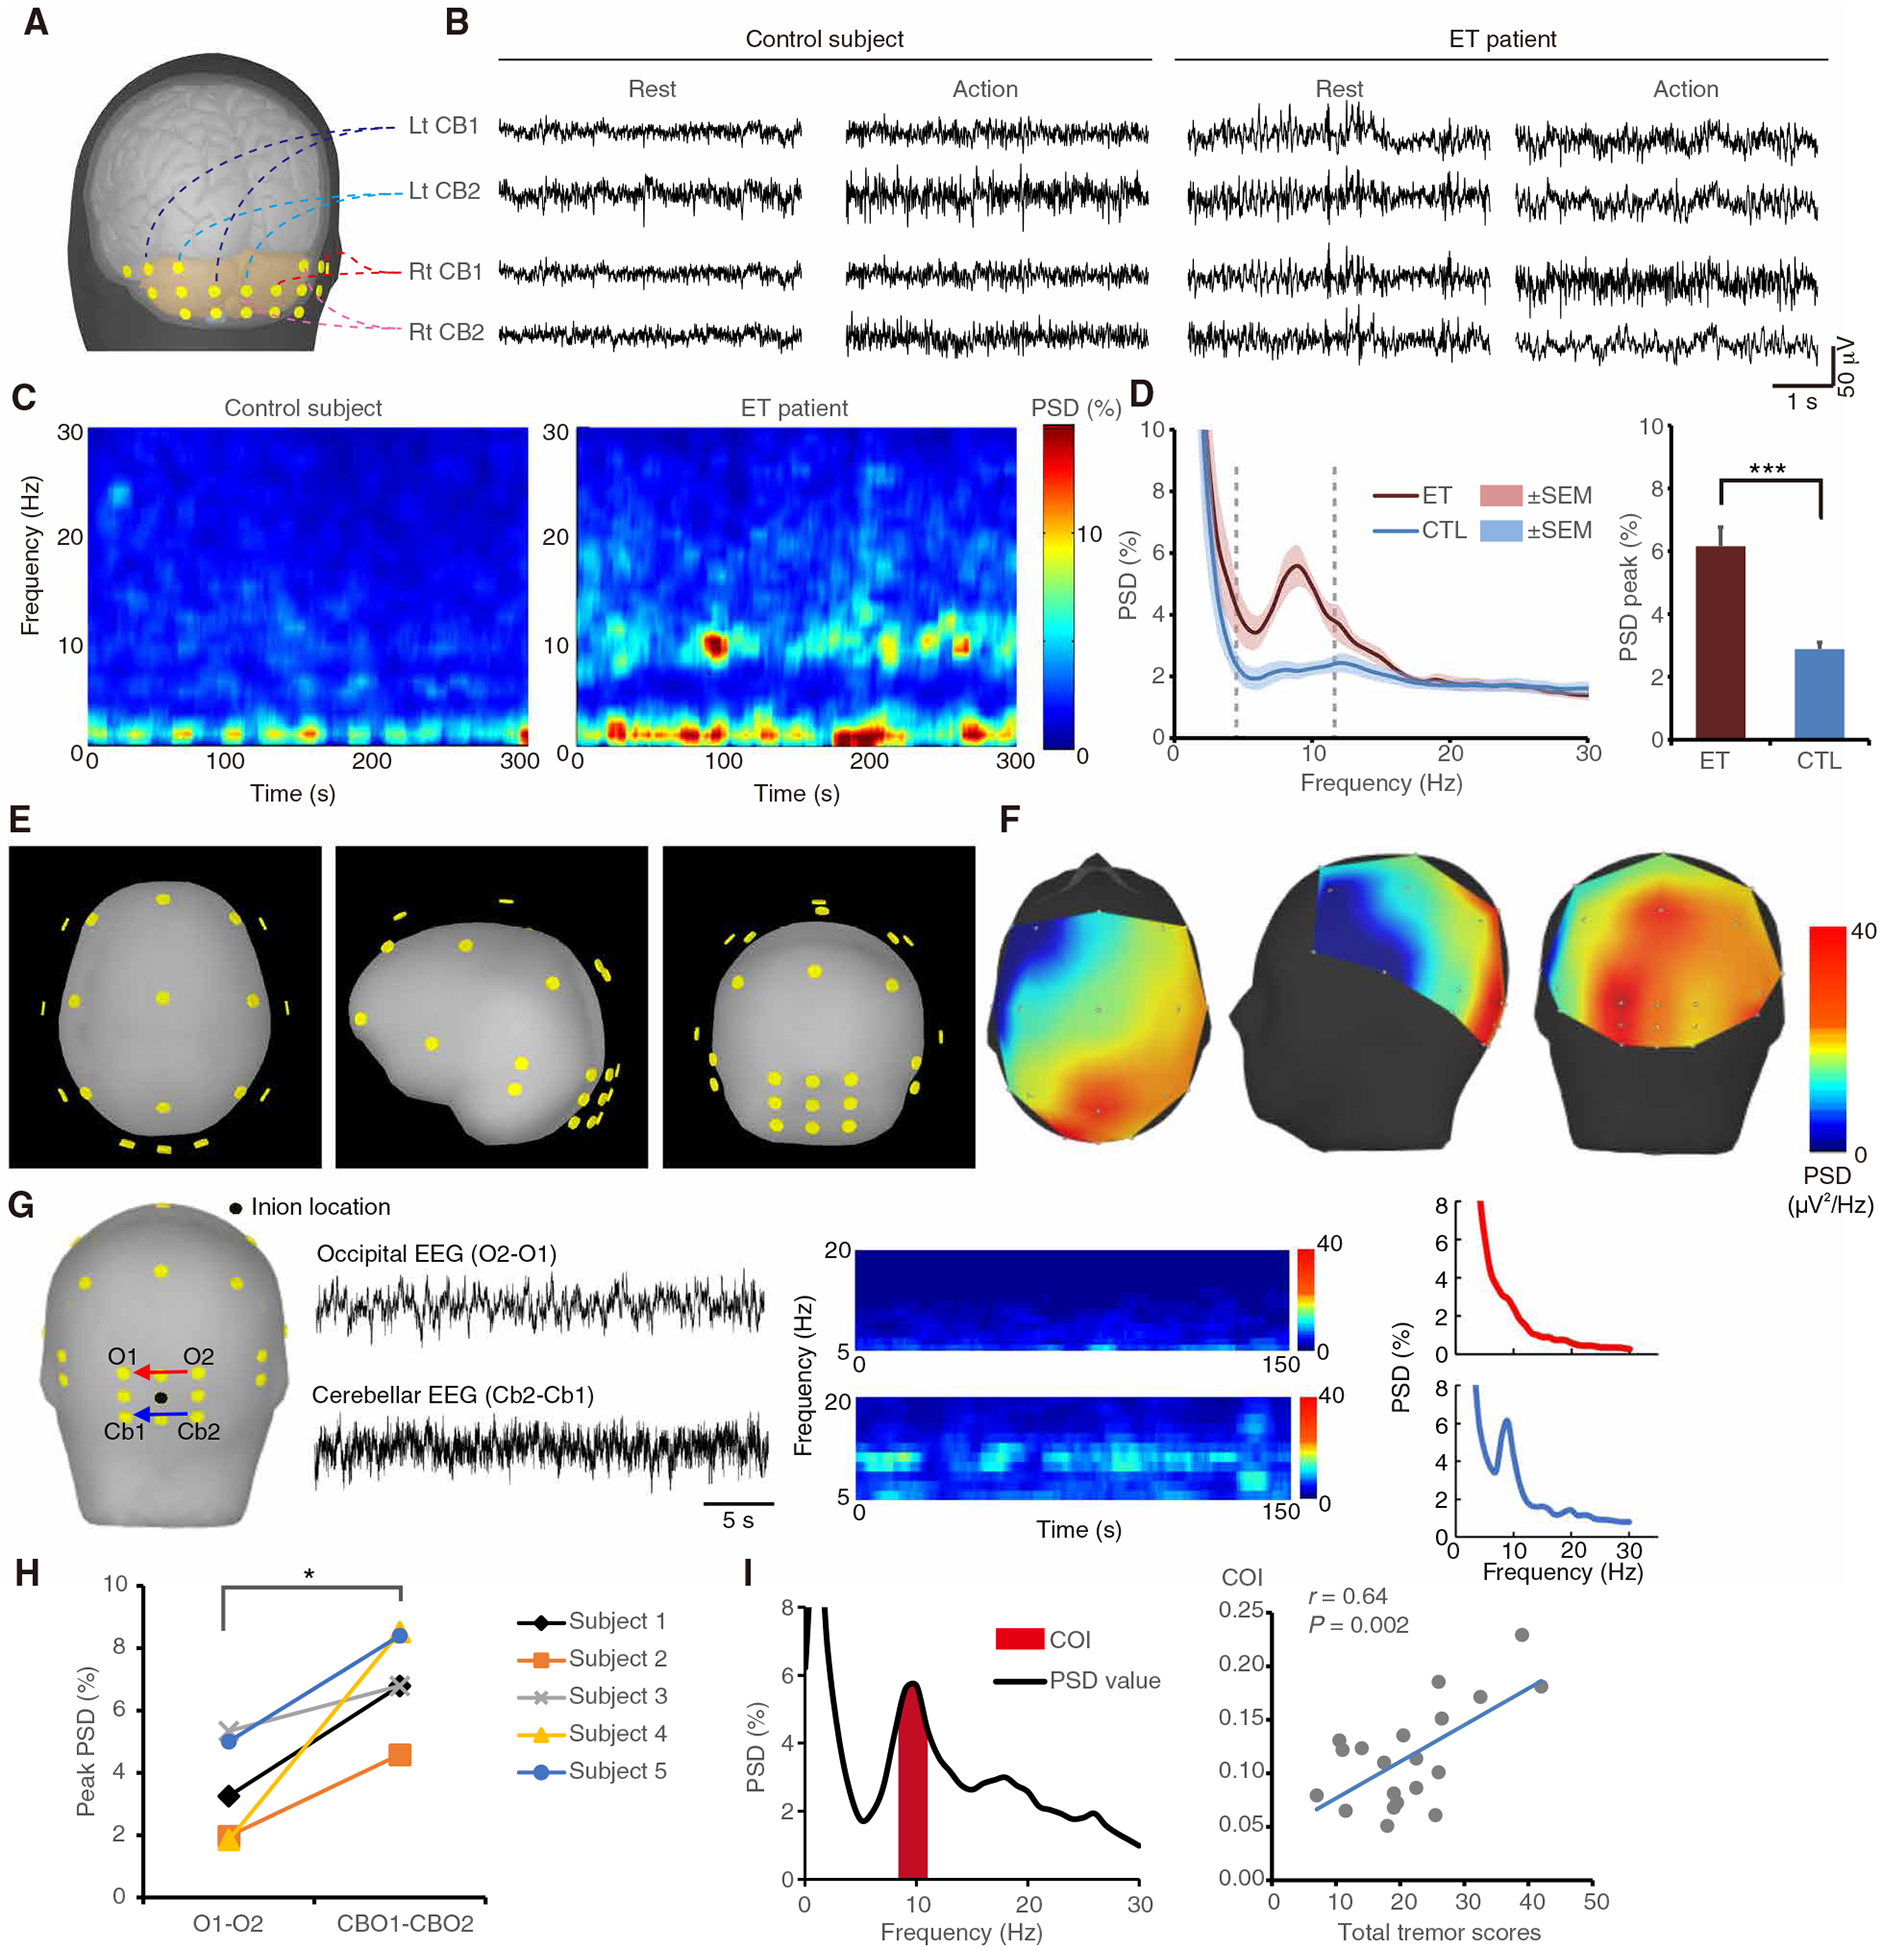
(A and B) Human cerebellar electroencephalogram (EEG) recorded in the different cerebellar regions in both patients and controls. (C and D) Representative time-frequency plots (C), and corresponding PSD diagrams and group analysis [(D) n = 10 patients and 10 age-matched controls; ***P < 0.001 by Mann-Whitney test]. (E to H) Source localization and bipolar comparison of cerebellar oscillations in patients with ET. EEG was recorded in awake patients under eyes-open condition to suppress occipital alpha rhythm. Location of EEG leads (E) and representative PSD diagrams (F) with color-coded EEG intensity at human tremor frequency (4 to 12 Hz). The highest intensity (red) is located in the cerebellar region. Direct comparison between cerebellar leads (Cb2-Cb1) and occipital leads (O2-O1) in a representative patient (G) and group analysis [(H) n = 5 patients; *P < 0.05 by Wilcoxon signed-rank test]. (I) Cerebellar oscillatory index (COI) and its correlation with tremor severity in patients in an extended cohort (n = 20 patients, r = 0.64, P = 0.002 by Pearson’s correlation coefficient). Error bars denote SEM.