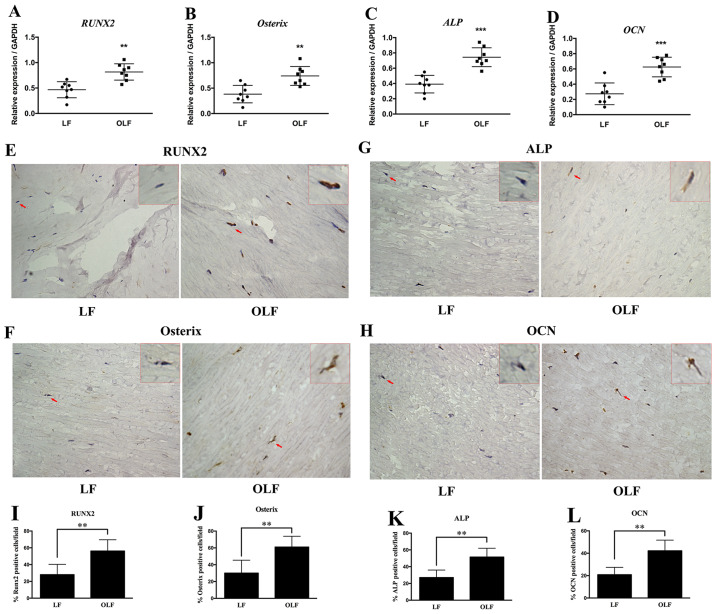
Figure 1.
Expression of RUNX2, Osterix, ALP and OCN in LF and OLF tissues. Reverse transcription-quantitative PCR results for the mRNA expression levels of (A) RUNX2, (B) Osterix, (C) ALP and (D) OCN in the LF and OLF groups. Immunohistochemistry images of (E) RUNX2, (F) Osterix, (G) ALP and (H) OCN. Quantification of the protein expression levels of (I) RUNX2, (J) Osterix, (K) ALP and (L) OCN in the LF group and OLF group. Magnification, ×400. The red arrows represent the typical cells, which were magnified and shown in the upper right-hand corner (magnification, × 1,600). N=8. **P<0.01, ***P<0.001 vs. LF samples. OLF, ossification of ligamentum flavum; LF, ligamentum flavum; RUNX2, Runt-related transcription factor 2; ALP, alkaline phosphatase; OCN, osteocalcin.

