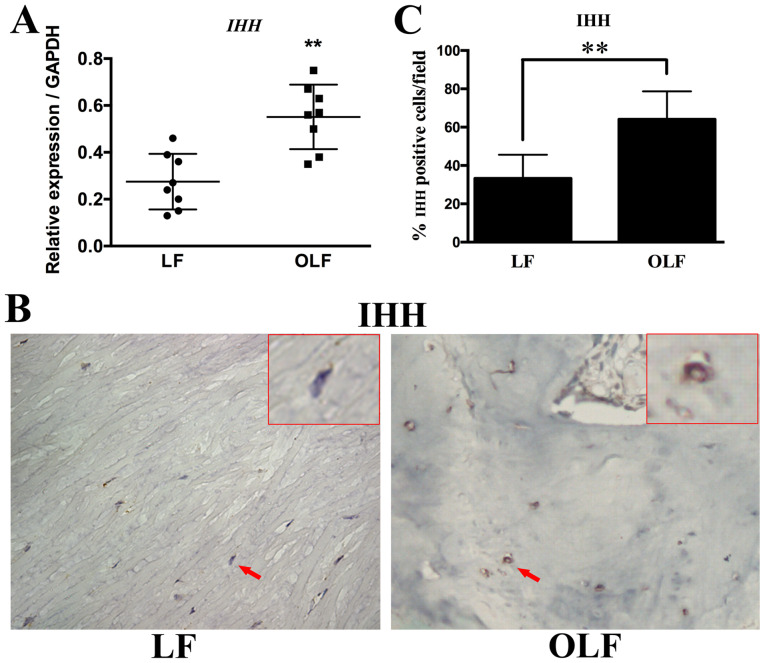
Figure 2.
Expression level of IHH in LF and OLF tissues. (A) Reverse transcription-quantitative PCR results showed the mRNA expression levels of IHH between the LF group and OLF group. (B) Representative images of immunohistochemistry staining from each group. Magnification, ×400. The red arrows represent the typical cells, which were magnified and shown in the upper right-hand corner (magnification, ×1,600). (C) Immunohistochemistry results of the protein expression levels of IHH in the LF group and OLF group. N=8. **P<0.01 vs. LF samples. IHH, Indian hedgehog; OLF, ossification of ligamentum flavum; LF, ligamentum flavum.

