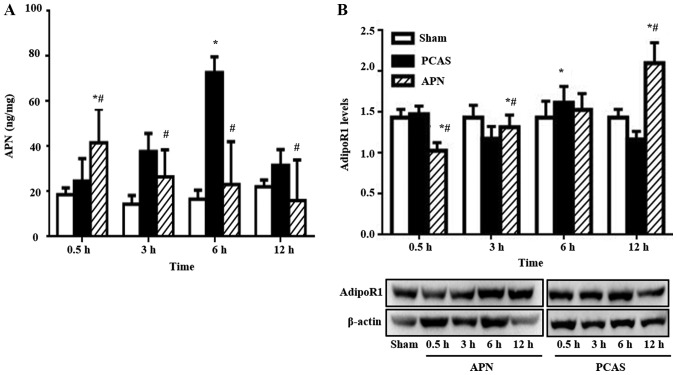
Figure 6.
The variation of serum APN level and its receptor expressed in different groups. The variation of (A) serum APN level and (B) its receptor expressed at 0.5, 3, 6 and 12 h of reperfusion in different groups. Representative immunoblots are shown below the quantified data. Data are presented as means ± standard errors of the mean (n=5 per group). *P<0.05 vs. Sham group, #P<0.05 vs. PCAS group. APN, adiponectin; PCAS, post cardiac arrest syndrome.

