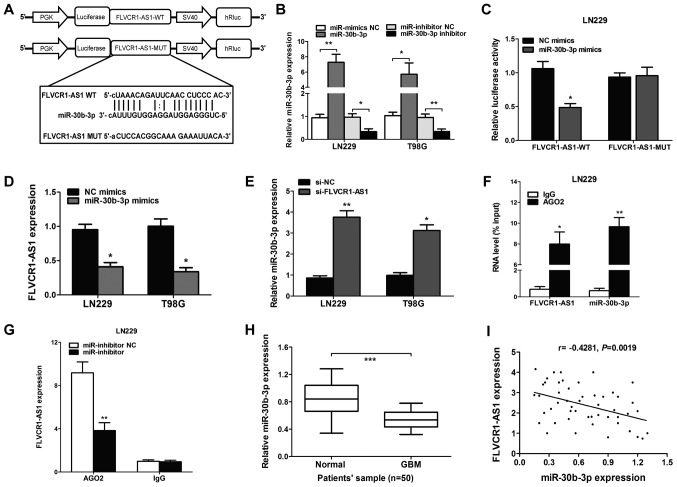
Figure 4.
FLVCR1-AS1 is targeted by miR-30b-3p at the 3′UTR. (A) Target site of miR-30b-3p in the 3′UTR region of FLVCR1-AS1. (B) miR-30b-3p expression was upregulated by miR-30b-3p mimics compared with the miR-mimic NC (**P<0.01 in LN229 and T98G cells), or inhibited by an miR-30b-3p inhibitor compared with the miR-inhibitor NC (*P<0.05 and **P<0.01), respectively, in LN229 and T98G cells. (C) Relative luciferase activity was determined following co-transfection of LN229 cells with miR-30b-3p mimics or miR-NC and FLVCR1-AS1-WT or FLVCR1-AS1-MUT. (D) After transfection with miR-30b-3p mimics, the level of FLVCR1-AS1 was decreased in LN229 cells, as detected by RT-qPCR. (E) Expression levels of miR-30b-3p in GBM cell lines following transfection with si-FLVCR1-AS1 or si-NC. (F) Association between FLVCR1-AS1 and miR-30b-3p with AGO2. (G) Change in FLVCR1-AS1 level in glioma cells transfected with an miR-30b-3p inhibitor. AGO2 RNA level determined by RT-qPCR. (H) Expression level of miR-30b-3p in GBM compared with adjacent normal tissues. (I) Pearson's correlation coefficient analysis between FLVCR1-AS1 and miR-30b-3p expression level. *P<0.05, **P<0.01 and ***P<0.001. Experiments were repeated three times. FLVCR1-AS1, Feline Leukemia Virus Subgroup C Cellular Receptor 1 Antisense RNA 1; miR, microRNA; NC, negative control; UTR, untranslated region; WT, wild-type; MUT, mutant; siRNA, small interfering RNA; IgG, immunoglobulin G; RT-qPCR, reverse transcription-quantitative PCR; GBM, glioblastoma.

