
Figure 2.
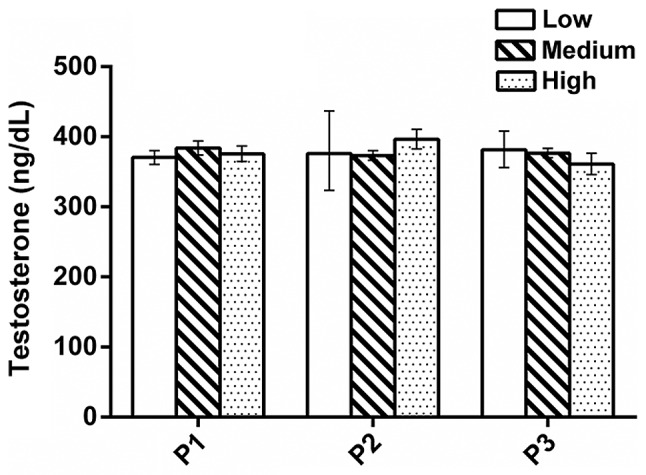
Stability test of sample preparation (n=3; error bar: Standard deviation). All data were presented as the mean ± standard deviation and 3 repeats were included for each parameter at each duration/concentration tested.
Official websites use .gov
A
.gov website belongs to an official
government organization in the United States.
Secure .gov websites use HTTPS
A lock (
) or https:// means you've safely
connected to the .gov website. Share sensitive
information only on official, secure websites.
Stability test of sample preparation (n=3; error bar: Standard deviation). All data were presented as the mean ± standard deviation and 3 repeats were included for each parameter at each duration/concentration tested.