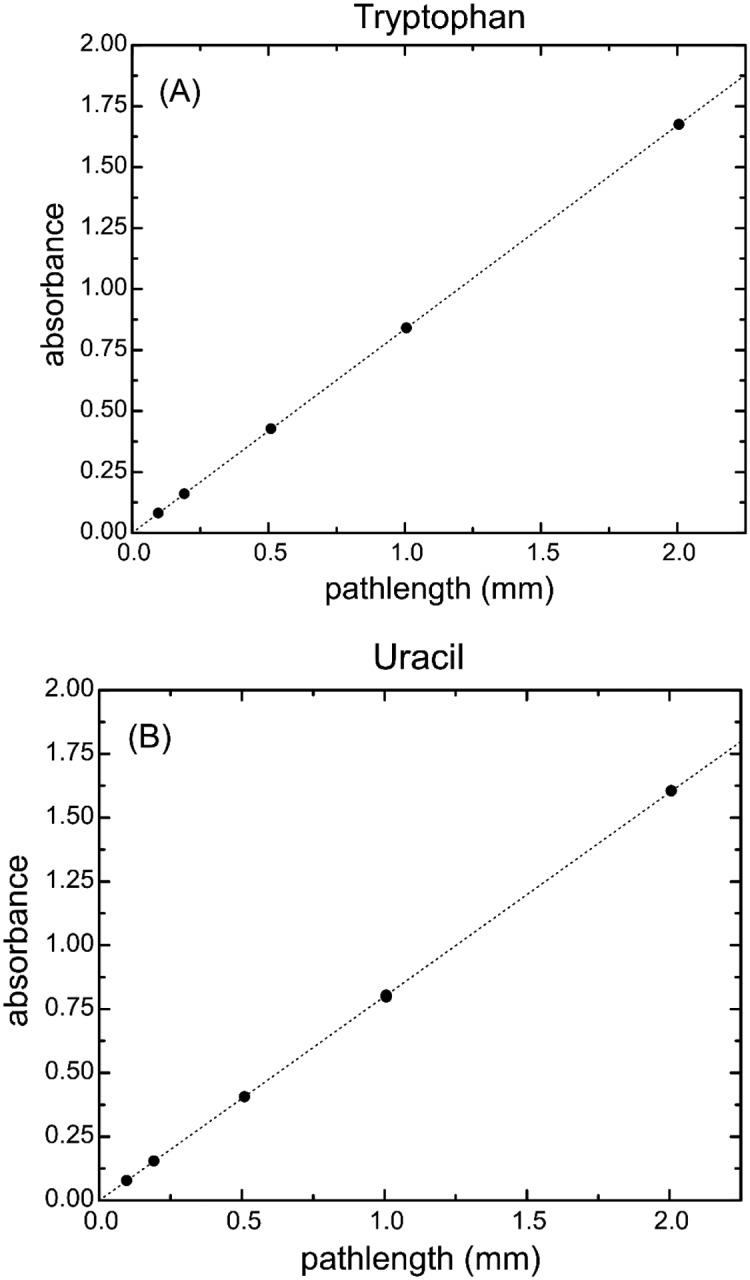
Fig. 3.

Bias-corrected absorbance versus cuvette pathlength for (A) the tryptophan solution at 280 nm and (B) the uracil solution at 260 nm. Standard deviations and the associated uncertainties for each measurement are smaller than the symbol size and are not shown in the figure.
