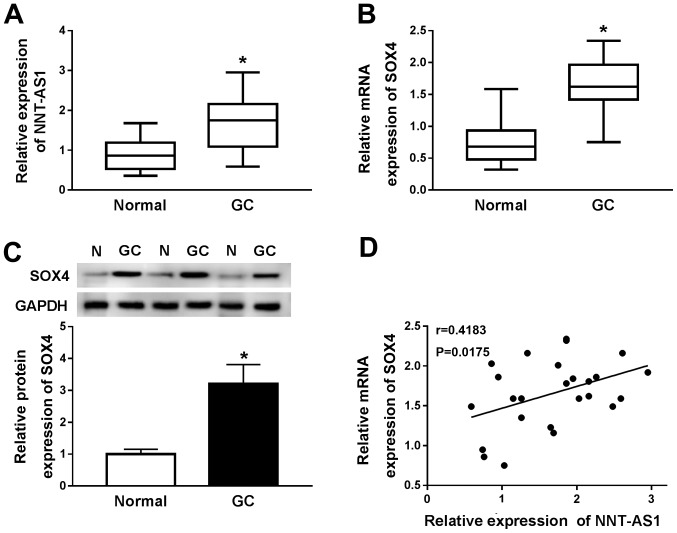
Figure 1.
Expression levels of NNT-AS1 and SOX4 in GC tissues. mRNA expression levels of (A) NNT-AS1 and (B) SOX4 in 25 paired GC and adjacent normal tissues. (C) Protein expression levels of SOX4 in GC and adjacent normal tissues. (D) Spearman's correlation analysis was performed to assess the relationship between NNT-AS1 and SOX4 expression in GC tissues. *P<0.05 vs. normal. NNT-AS1, nicotinamide nucleotide transhydrogenase-antisense RNA1; SOX4, sex-determining region Y-related high mobility group box 4; GC, gastric cancer; N, normal.

