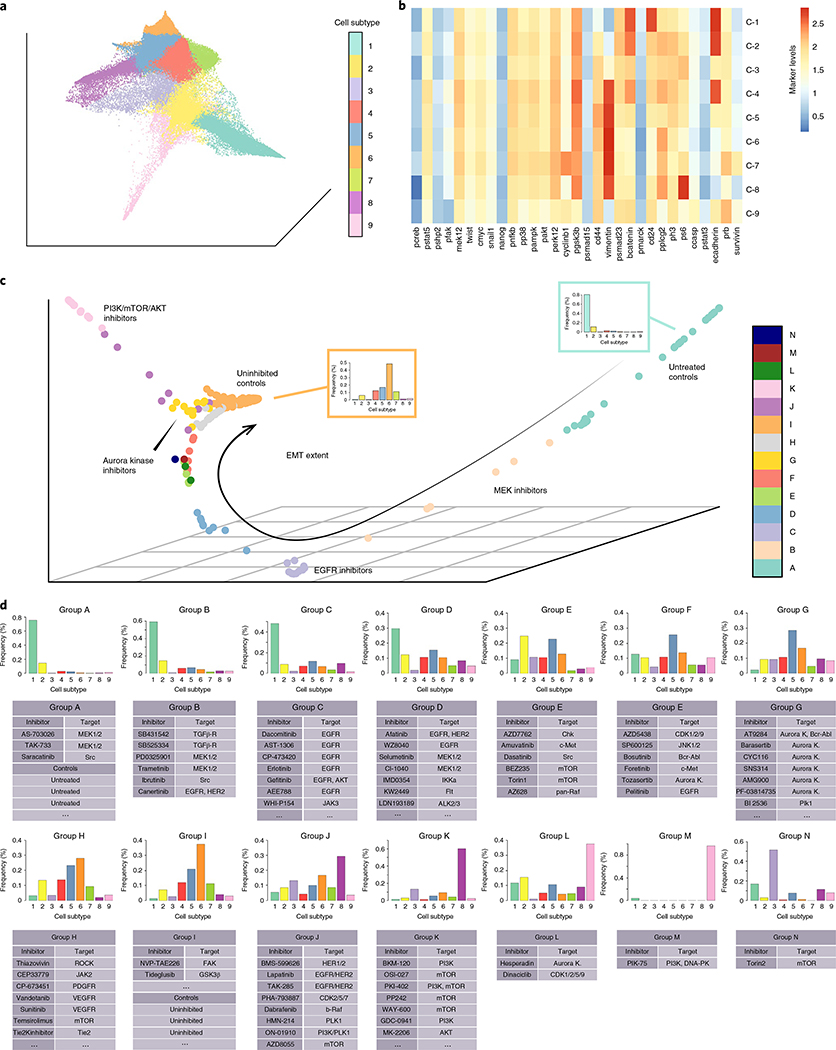
Fig. 3 |. Axes of variation among EMT perturbation conditions.
a, PHATE embedding of cells from all 300 experimental conditions, colored by cell subtype. b, Heatmap representing log2 protein expression levels for each cell subpopulation representing its respective cell subtype. c, Diffusion map embedding of control and drug-inhibited conditions, colored by clusters determined by hierarchical clustering. d, Individual inhibitors assigned to each inhibitor group. Histograms represent bin-wise mean of relative frequency of each cell subtype for all inhibitors in a given group. The full list of inhibitors in each group can be found in Supplementary Table 3.

