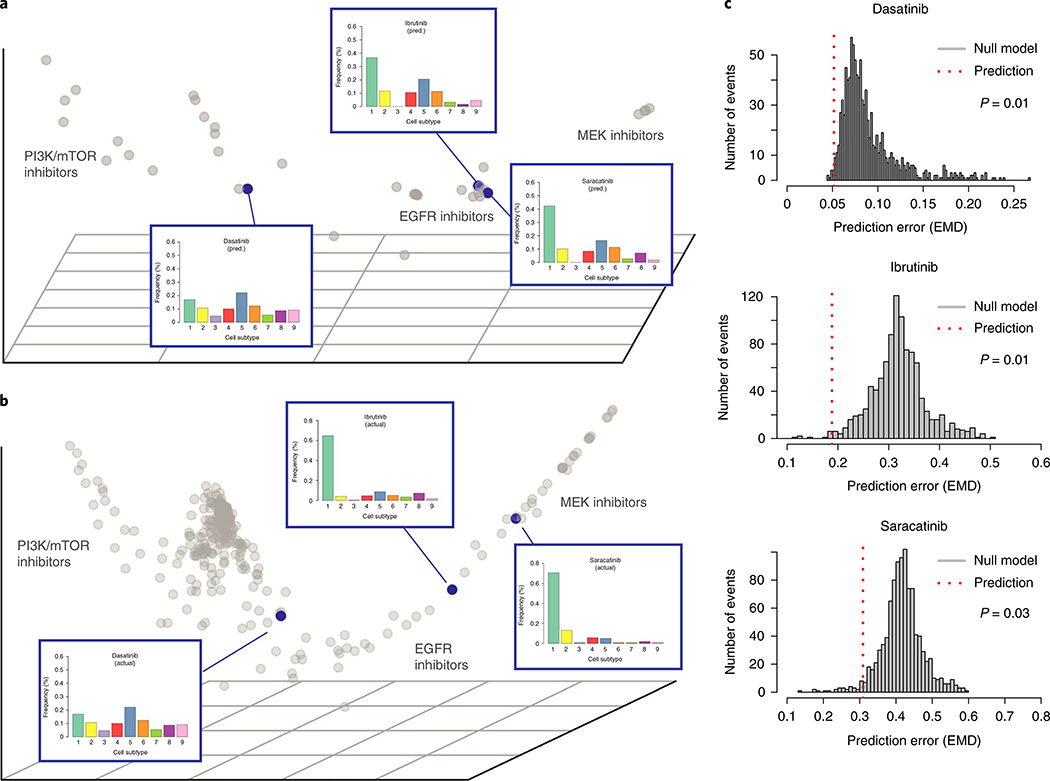
Fig. 4 |. Nyström extension predicts single-cell profiles of unmeasured EMT perturbation conditions.
a, Nystrom extension embedding showing predicted effect of three selected inhibitors (dasatinib, ibrutinib, saracatinib) on EMT relatively to other measured inhibitors. b, PhEMD diffusion map embedding showing measured effects of three selected inhibitors on EMT. c, Histogram showing distribution of prediction error for null model (n = 1,000 independent permutations). Dotted red line represents prediction error for actual prediction (that is, alternative model). P values were computed using a one-sided permutation test.

