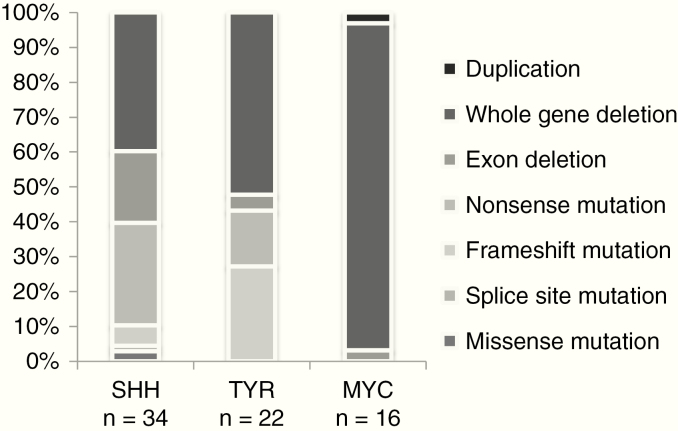
Fig. 3.
The genetic heterogeneity of SMARCB1 mutations in ATRT. The spectrum of SMARCB1 mutations in ATRT DNA-methylation subgroups among 72 patients is presented. Each column represents a DNA methylation subgroup as defined by a DNA methylation classifier. The x-axis gives the percentage of mutations detected in alleles in each subgroup. Whole gene deletions were rather common, followed in frequency by exon deletions and nonsense single nucleotide variations.

