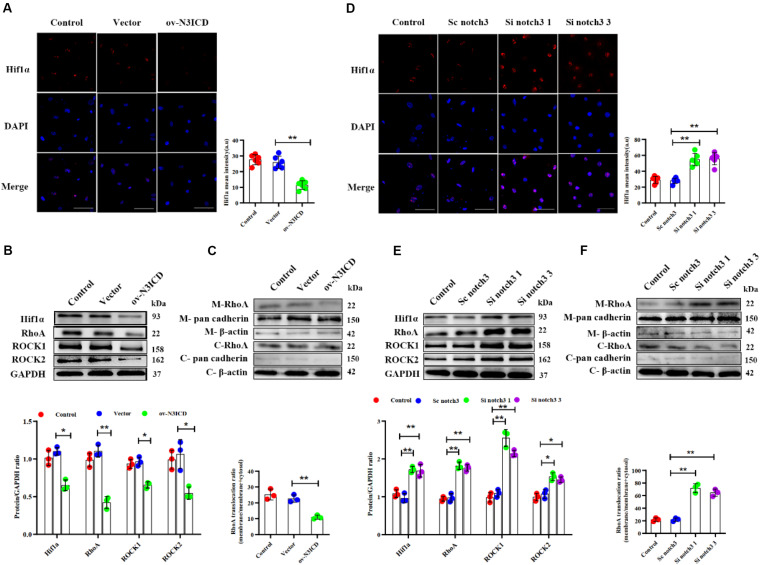
FIGURE 5.
The effects of notch3 on Hif1α, RhoA, ROCK1, and ROCK2 in rat cardiac fibroblasts (CFs) with different treatments. (A) Representative immunofluorescence images and quantitative data of Hif1α (red) in neonatal rat cardiac fibroblasts after notch3 overexpression (n = 6). Nuclei were detected with DAPI (blue). Scale bars = 200 μm. (B) The protein expression of Hif1α, RhoA, ROCK1, and ROCK2 was determined by western blot after notch3 overexpression (n = 3). (C) Western blots of RhoA in the membrane and cytosol after notch3 overexpression (n = 3). (D) Hif1α (red) in neonatal rat cardiac fibroblasts after notch3 knockdown was detected by immunofluorescence and statistical analysis of mean intensity (n = 6). Nuclei were detected with DAPI (blue). Scale bars = 200 μm. (E) Hif1α, RhoA, ROCK1, and ROCK2 were detected by western blot after notch3 silencing (n = 3). (F) Western blots of RhoA and cadherins in the membrane and cytosol after notch3 silencing (n = 3). Values represent the mean ± SD. *P < 0.05, **P < 0.01. M-RhoA, membrane RhoA; C-RhoA, cytosolic RhoA; M-pan cadherin, membrane pan cadherin; C-pan cadherin, cytosolic pan cadherin; M-β-actin, membrane β-actin; C-β-actin, cytosolic β-actin.

