
Figure 3. Enteric Neuronal IL-18 Is Protective against S.t. Infection.
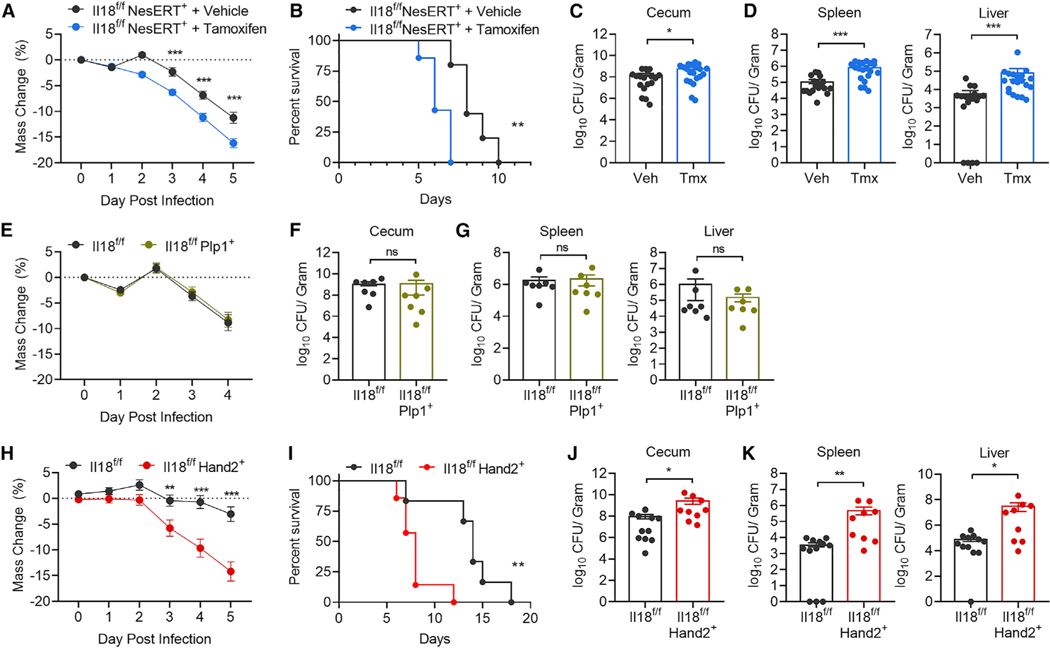
(A) Weight loss of Il18f/fNesERT+ mice pretreated with tamoxifen (TMX) (n = 20) or vehicle (n = 18) then infected with S.t. Data represent mean ± SEM; unpaired t test was used for statistical analysis. Data represent two independent experiments combined from three total independent experiments.
(B) Survival curve for S.t.-infected Il18f/fNesERT+ mice pretreated with TMX (n = 5) or vehicle (n = 7). Log rank test was used for analysis. Data represent two independent experiments combined.
(C and D) S.t. CFU/g of (C) cecum, (D) spleen, and liver from Il18f/fNesERT+ mice, pretreated with vehicle or TMX, 5 days post-infection. Data represent mean ± SEM; Mann-Whitney test was used for statistical analysis. Each dot represents one mouse. Data represent two independent experiments combined from three total independent experiments.
(E) Weight loss of Il18f/f (n = 7) or Il18f/fPlp1+ (n = 7) mice pretreated with TMX then infected with S.t. Data represent mean ± SEM; unpaired t test was used for statistical analysis. Data represent two independent experiments combined.
(F and G) S.t. CFU/g of (F) cecum, (G) spleen, and liver from Il18f/f (n = 7) or Il18f/fPlp1+ (n = 7) pretreated with TMX, 4 days post-infection. Data represent mean ± SEM; Mann-Whitney test was used for statistical analysis. Each dot represents one mouse. Data represent two independent experiments combined.
(H) Weight loss of Il18f/f (n = 20) or Il18f/fHand2+ (n = 17) mice infected S.t. Data represent mean ± SEM; unpaired t test was used for statistical analysis. Data represent two independent experiments combined from three total independent experiments.
(I) Survival curve for S.t.-infected Il18f/f (n = 6) or Il18f/fHand2+ (n = 7) mice. Log rank test was used for analysis. Data represent two independent experiments combined.
(J and K) S.t. CFU/g of (J) cecum, (K) spleen, and liver from Il18f/f or Il18f/fHand2+ mice 5 days post-infection. Data represent mean ± SEM; Mann-Whitney test was used for statistical analysis. Each dot represents one mouse. Data represent two independent experiments combined from three total independent experiments.
*p < 0.05, **p < 0.01, ***p < 0.001, ****p < 0.0001